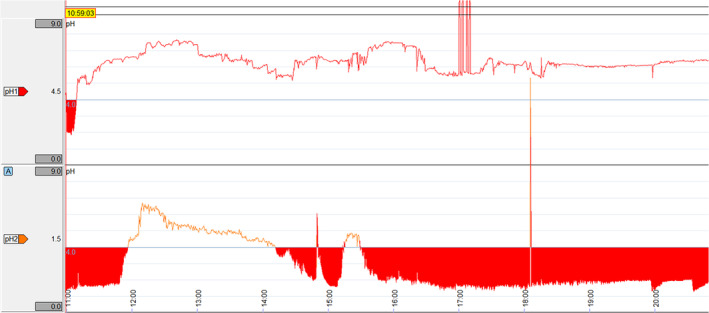
FIGURE 4.

Example of a graph of pH over time for squamous (top) and glandular (bottom) capsules generated by the software. Time (24‐hour clock) is on the x‐axis and pH is on the y‐axis. pH <4 is highlighted by red shading. The sharp vertical lines that extend beyond the y‐axis represent artifacts because of temporary transmission failure.
