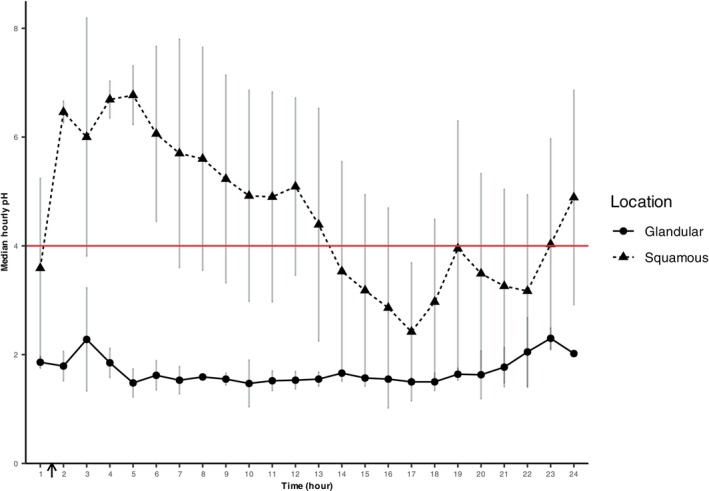
FIGURE 6.

Median (individual) hourly pH at squamous and glandular locations over the first 24 hours after attachment for all capsules with ≥24 hours attachment and pH data (n = 8). Data are shown as mean ± SD. Feed was reintroduced between hours 1 and 2 (black arrow). Feed was withheld overnight from 8 pm and gastroscopy was performed at 8 am the following day, corresponding to periods starting at hours 8‐11 and ending at hours 20‐23.
