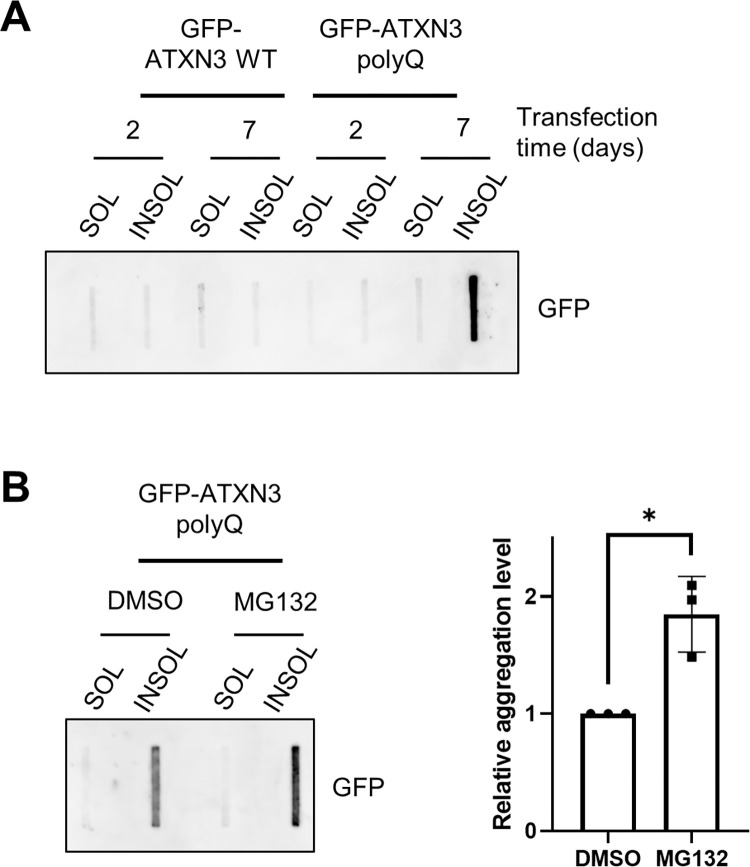
Fig 3. FTA analysis of ATXN3 aggregates.
(A) HEK-239T transfected with the indicated expression plasmids were collected at the indicated times and subjected to the fractionation and FTA protocols described in S1 File. The membrane was subsequently immunoblotted with anti-GFP antibody. (B) HEK-239T cells expressing GFP-ATXN3 polyQ for 7 days were treated with DMSO or 5 μM MG132 overnight, after which cells were collected and analysed as in A (left panel). The relative GFP signal from the insoluble fractions was quantified (n = 3) and normalized to the signal of the DMSO-treated cells (right panel). Student’s t‐test was used to calculate the statistical significance. Error bars represent the standard deviation. * p<0.05.

