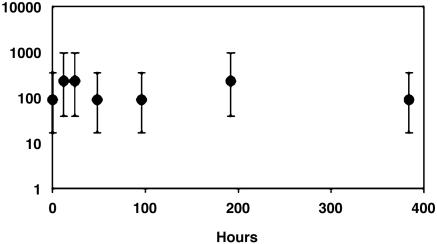
Fig. 4.
Survival of GSB1 during exposure to air in darkness and the absence of H2S. The vertical axis (log10 scale) gives percentages of viable cells based on most probable number (MPN) enumerations relative to microscopic counts (19, 20), and the horizontal axis gives the time of incubation. Points give average values, and vertical bars indicate 95% confidence limits.

