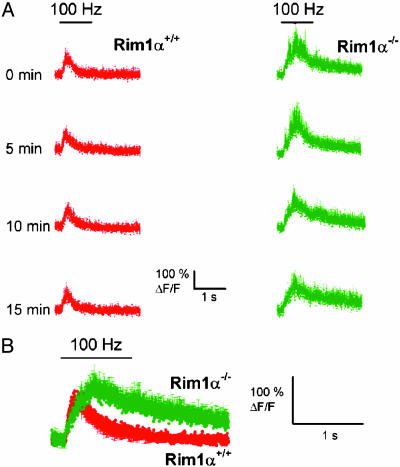
Fig. 5.
Calcium response in the dendritic spines of postsynaptic CA1 neurons upon LTP induction in RIM1α+/+ (red) and RIM1α-/- (green) mice. (A) Averaged CA1 spine Ca2+ signals, measured as ΔF/F0 (change in fluorescence intensity divided by initial baseline fluorescence intensity ×100%), in dendritic spines in response to each of four trains of 1-s, 100-Hz Schaffer collateral stimulation given every 5 min (times shown on the left) in RIM1α+/+ (Left) mice (n = 4) and RIM1α-/- (Right) mice (n = 4). (B) Averaged Ca2+ signal from all four trains shown in A. (Error bars show SE.)

