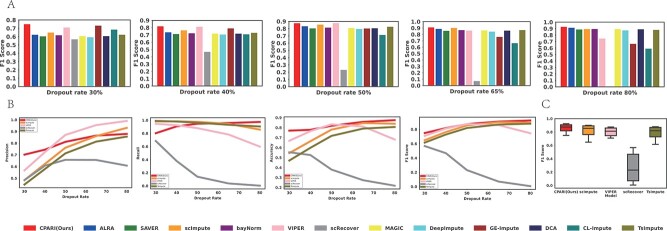
Figure 2.
Evaluation of imputation methods for dropout zero identification. (A) Bar plots illustrating the imputation F1 score for various imputation methods across different dropout levels. (B) Line graphs depicting the trends of precision, recall, accuracy, and F1 score for different imputation methods under each dropout level. (C) Box plots representing the distribution of F1 scores for imputation methods across different dropout datasets.

