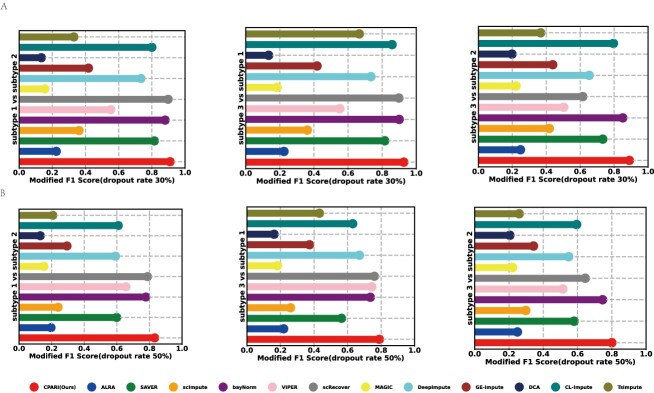
Figure 5.
Evaluation of imputation methods for single-cell differential expression analysis. (A) Lollipop charts illustrating the modified F1 scores for the three cell types relative to each other at a 30% dropout rate. (B) Lollipop charts depicting the modified F1 scores for the three cell types relative to each other at a 50% dropout rate.

