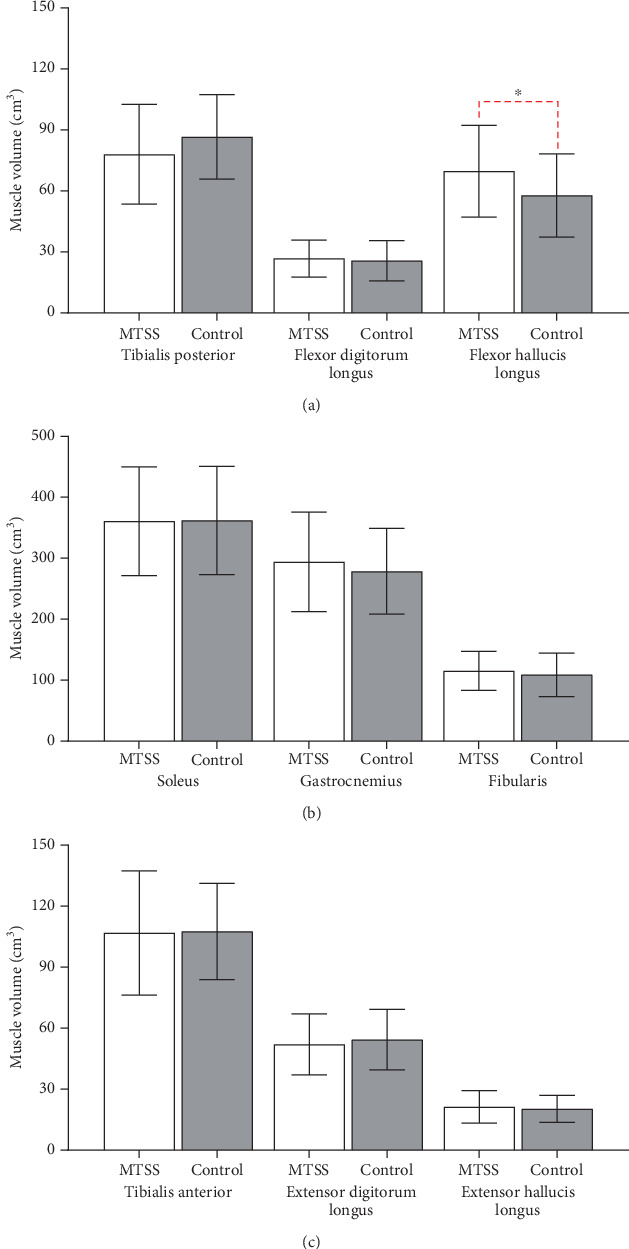
Figure 2.

Bar graphs comparing (a) lower leg deep posterior compartment muscle volume, (b) lower leg superficial posterior and lateral compartment muscle volume, and (c) lower leg anterior compartment muscle volume. Red dotted loops indicate comparisons between muscle groups between MTSS standard deviation. MTSS = medial tibial stress syndrome group, control = control group, cm3 = cubic centimeter.
