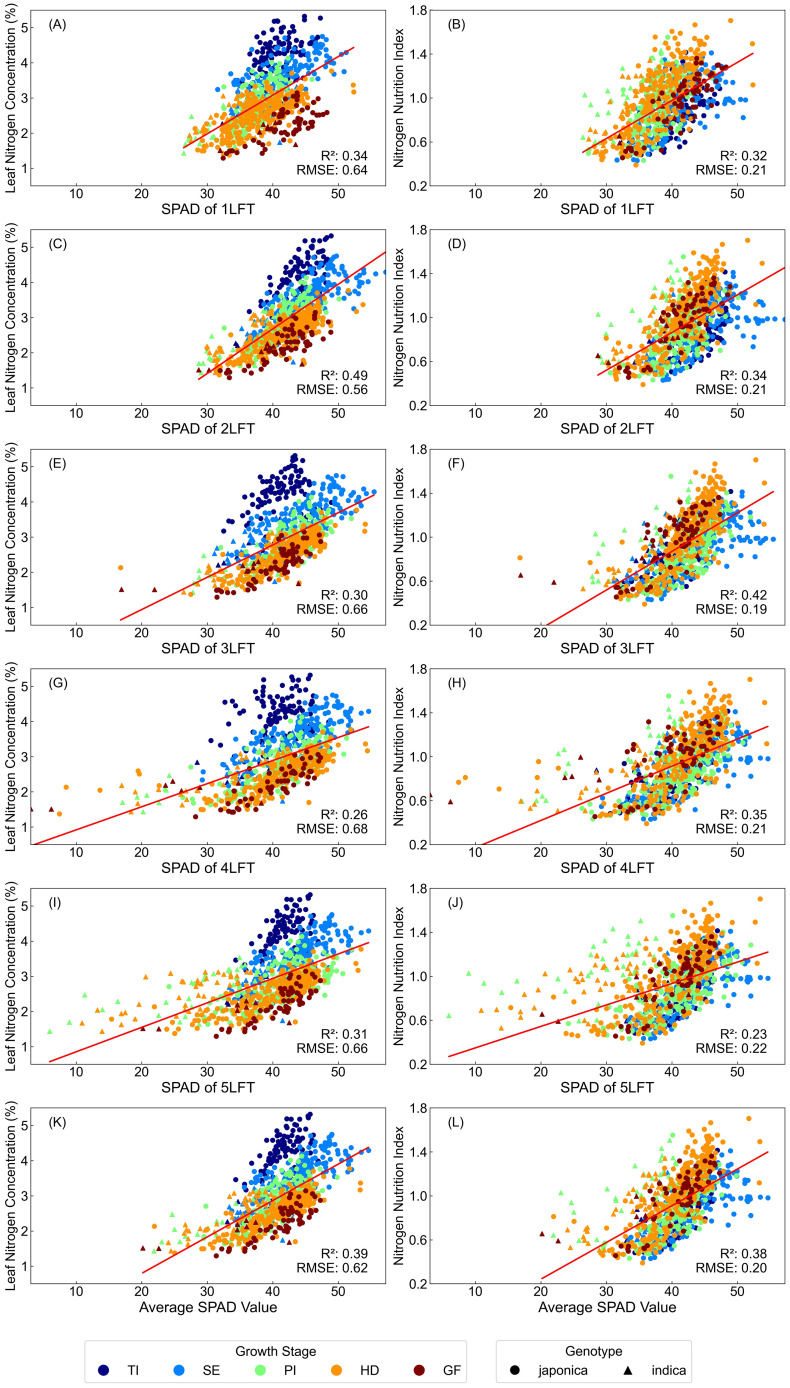
Figure 3.
Linear regression analysis between SPAD readings from different leaf positions and LNC and NNI across different growth stages and cultivars (n=933). (A–J) represent scatter plots for SPAD readings from the 1st to 5th leaf from the top (LFT) and their corresponding LNC (A, C, E, G, I) or NNI (B, D, F, H, J) values. (K, L) show the scatter plots for the average SPAD readings across the 1st to 5th LFT and their corresponding LNC (K) or NNI (L) values.

