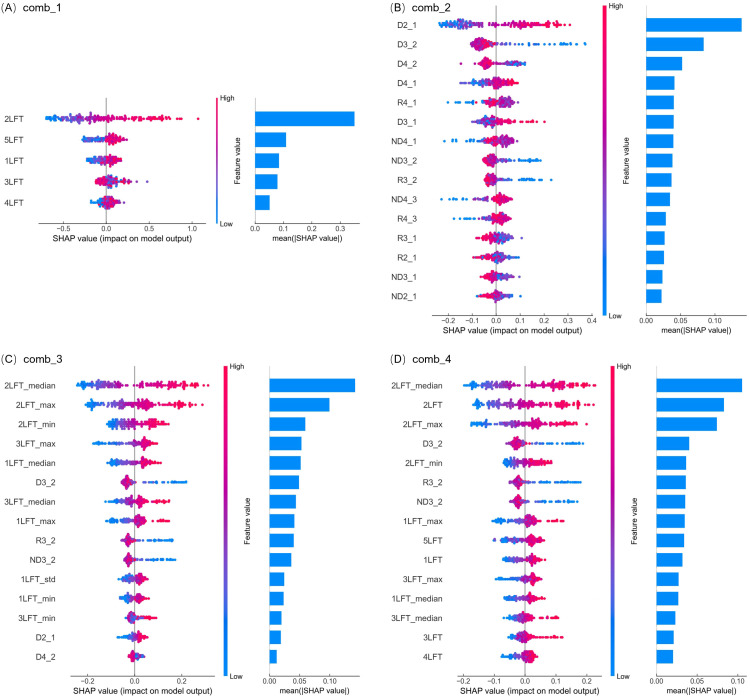
Figure 5.
SHAP analysis of feature importance in predicting rice LNC with the random forest model across four input variable combinations. (A–D) correspond to the results for input variable combinations comb_1, comb_2, comb_3, and comb_4, respectively. The left side of each subplot shows SHAP value distributions, where each dot represents a data point from the validation dataset. The x-axis indicates the feature's impact on the model's prediction, and the dot color reflects the feature value, ranging from blue (low) to pink (high). Positive SHAP values indicate that the feature increases the prediction, while negative values indicate a decrease. The right side presents a bar chart (sharing the Y-axis with the left-side chart), with features ranked in descending order of their average absolute SHAP values, highlighting the most influential variables for the model's accuracy.

