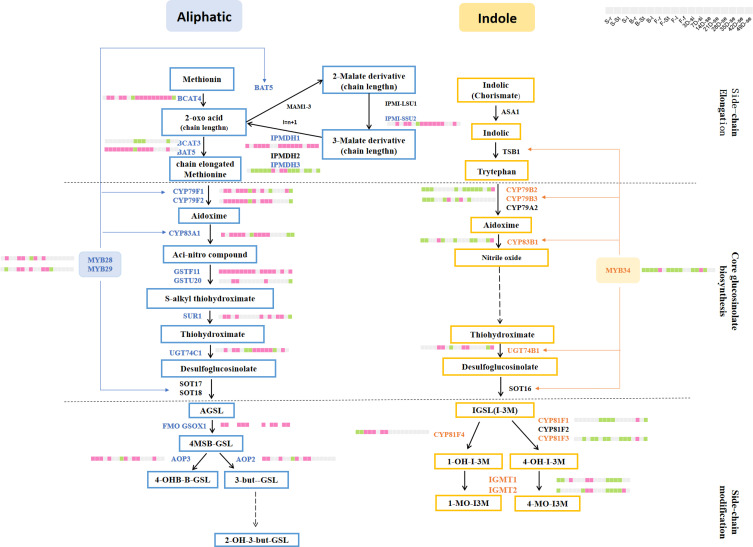
Figure 5.
The DEGs between ZY821 and ZS11 in the AGSL and IGSL pathways. Pink box represents the DEGs have higher expression levels in ZY821 than in ZS11; Green box represents the expression levels of the DEGs in ZS11 higher than in ZY821; Gray box represents these with similar expression value in ZS11 and ZY821.

