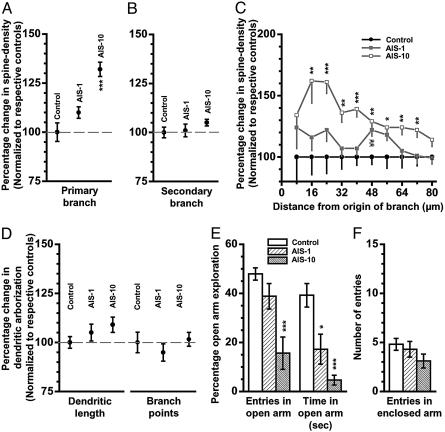
Fig. 2.
Effects of AIS on spine density, dendritic arborization, and anxiety-like behavior. For all graphs in A–D, summarizing changes in spine density or dendritic arbors, the ordinate depicts mean (±SEM) values for BLA spiny neurons from AIS-1 and AIS-10 animals, normalized to their respective control values (100%) for that parameter. (A) Percentage changes in spine density, relative to normalized control (100%), calculated from the total number of spines along an 80-μm segment of primary branch in spiny BLA neurons from AIS-1 and AIS-10 animals. Control, n = 18 neurons; AIS-1, n = 18 neurons; AIS-10, n = 30 neurons. One-way ANOVA; F(2, 63) = 19.2, P < 0.001 for differences between groups; least significant difference (LSD) posthoc test; ***, P < 0.001. (B) Percentage changes in spine density, relative to normalized control (100%), calculated from the total number of spines along an 80-μm segment of secondary branch in spiny BLA neurons from AIS-1 and AIS-10 animals. One-way ANOVA; F(2, 63) = 1.1, P > 0.3 for differences between groups. (C) Analysis of the percentage changes in spine density for each segment (mean ± SEM, normalized to respective control) for each successive 8-μm segment along primary branch as a function of the distance of that segment from the origin of the branch. Statistical significance was computed for each segment independently by using one-way ANOVA. *, P < 0.05; **, P < 0.01; ***, P < 0.001 between control and AIS-10; LSD posthoc test. ¥¥, P < 0.01 between control and AIS-1. (D) Percentage changes, relative to normalized control (100%), in total dendritic length (Left) and number of branch points (Right) of BLA spiny neurons from control (n = 18 neurons), AIS-1 (n = 18 neurons), and AIS-10 (n = 30 neurons) groups. One-way ANOVA; total dendritic length, F(2, 63) = 2.7 and P > 0.2 for differences between groups; number of branch points, F(2, 63) = 0.6 and P > 0.5 for differences between groups. (E) Anxiety-like behavior on the elevated plus-maze for all three experimental groups (control, AIS, and AIS-10). Changes in open-arm exploration were measured as the percentage of open-arm entries (Left) and the percentage of time spent in open arm (Right). (F) No effect on locomotor activity as measured by entries in enclosed arm in the plus-maze. Control, N = 10 animals; AIS-1, N = 4 animals; AIS-10, N = 8 animals. Kruskal–Wallis test for differences between three independent samples; P < 0.01 for the percentage of open-arm entries, P < 0.001 for the percentage of open-arm time, and P > 0.2 for the number of entries in enclosed arms. Significant effects were further analyzed by Mann–Whitney test; *, P < 0.05; ***, P < 0.001; relative to control.

