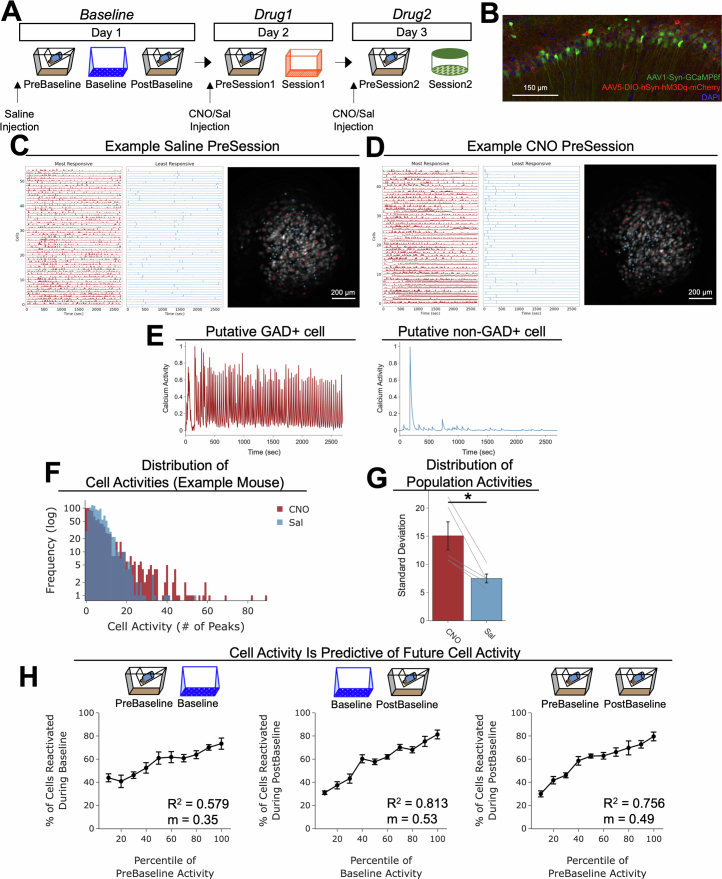
Extended Data Fig. 5. Characterization of inhibitory neuron tagging approach (chemotagging) to tag inhibitory neurons in vivo using Miniscope calcium imaging.
A) Schematic of calcium imaging experiment to test whether GAD+ cells could be robustly activated with hM3Dq receptor activation in inhibitory neurons. Gad2-cre mice were injected with a virus cocktail of AAV1-Syn-GCaMP6f and AAV5-DIO-hSyn-hM3Dq-mCherry into dorsal CA1 and had a lens implanted above CA1. After baseplating, recovery, and habituation, mice were injected with saline and placed in their homecage for a recording (PreBaseline), followed by exposure to a novel environment (Baseline) and then another homecage recording (PostBaseline). The following day, half the mice were administered CNO and the other half saline and were placed in their homecage for a recording (PreSession1), followed by exposure to a second novel context (Session1). The following day, mice were administered with the drug they did not receive the previous day (saline or CNO) and placed in their homecage for a recording (PreSession2), followed by exposure to a third novel context (Session2). This experiment was run one time. B) Example histology of CA1 of mice in the experiment. Green represents AAV1-Syn-GCaMP6f, red represents AAV5-DIO-hSyn-hM3Dq-mCherry, and blue represents DAPI. C) Example saline PreSession. Each row represents calcium activity of a neuron, of the top 5% of most highly active cells (in red) and the bottom 5% of most lowly active cells (in blue) during the saline PreSession. On the right is a maximum intensity projection demonstrating all the cells, with red and blue crosses representing the centres of mass of the most and least active cells (respectively) from the calcium activities on the left. D) As in Extended Data Fig. 5c, but of an example CNO PreSession. Here, it is apparent that the most active cells become highly active 5−10 min after the session begins, while the most lowly active cells become inactive 5−10 min after the session begins. E) Left: a representative cell that had heightened activity during the CNO PreSession. Right: a representative cell that had inhibited activity during the CNO PreSession. These two examples represent two extremes of cells that became highly active or inhibited. Cells highly responsive to CNO suggested that they may be putative inhibitory (i.e., GAD+) neurons, whereas cells not highly responsive to CNO suggested that they may be putative non-inhibitory (i.e., GAD-) neurons. F) Example distribution of calcium activities after saline vs CNO administration in the same mouse. In this example, it is apparent that CNO widens the distribution of cell activities, consistent with activation of inhibitory neurons and inhibition of excitatory neurons. G) Quantification of the standard deviation of activity across the population after CNO vs saline. After mice received CNO, the distribution of their population activity had a larger standard deviation, consistent with the idea that some cells become very active and others become very inactive, compared with administration of saline (t4 = 15.04, p = 0.018) (n = 5 mice). H) Quantification of how well the levels of cell activity at one point predict cell activity at a later timepoint. Left: The level of cell activity during the PreBaseline period is related to cell activity during Baseline (R2 = 0.579, slope = 0.35). Middle: Cell activity during Baseline is highly predictive of cell activity during PostBaseline (R2 = 0.813, slope = 0.53), as in Extended Data Fig. 3j. Right: Cell activity during PreBaseline is predictive of cell activity during PostBaseline (R2 = 0.756, slope = 0.49) (n = 5 mice).

