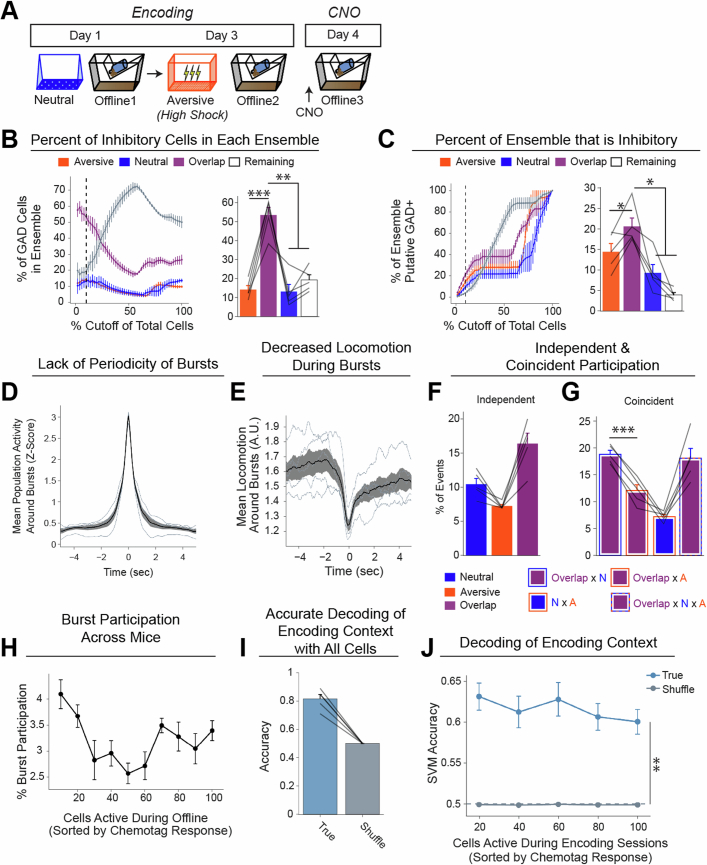
Extended Data Fig. 6. The Overlap ensemble comprises the largest fraction of inhibitory neurons.
A) Schematic of calcium imaging experiment to test the breakdown of inhibitory neurons across the ensembles. Gad2-cre mice were injected with a virus cocktail of AAV1-Syn-GCaMP6f and AAV5-DIO-hSyn-hM3Dq-mCherry into dorsal CA1 and had a lens implanted above CA1. After baseplating, recovery, and habituation, mice underwent Neutral encoding, followed by high-shock Aversive encoding two days later. After each encoding session, mice underwent a 1 hr offline recording. A day after Aversive encoding, mice were injected with CNO to identify the putative GAD+ cells while recording calcium activity from all neurons (see Extended Data Fig. 5). Then, these cells were cross-registered back to the neurons active during the offline period the day before. This allowed us to ask, of the ensembles recorded during the offline period, what fraction of each ensemble was made up by inhibitory neurons. This experiment was run one time. B) Here, we computed the percent of cells that were putative inhibitory neurons in each ensemble. We sorted the cells recorded during Offline 2 based on how highly active they were in response to CNO administration on CNO day (from most highly active cells on CNO day to least highly active; see Methods for details on how this was computed). During Offline 2, we asked what fraction of each ensemble (i.e., Aversive, Neutral, Overlap, Remaining) made up the inhibitory neurons. Rather than specifying an a priori threshold for what fraction of recorded cells would comprise the inhibitory neuron population, we parametrically varied the threshold for what fraction of the population was made up of putative inhibitory neurons and computed the fraction of each ensemble that made up this population at each threshold. The line graph (left) represents the parametrically varied thresholds along the x-axis (i.e., % Cutoff of Total Cells), and the y-axis represents the fraction of each ensemble at each threshold cutoff. Anatomical data have suggested that inhibitory neurons make up about 10% of the total number of neurons in the pyramidal layer of CA1 (which is the region we recorded from) (Bezaire & Soltesz, 2013). Thus, we extracted the 10% mark from the line graph (represented by the black dashed line) and compared the fractions at this cutoff (right bar graph). Here, the Overlap ensemble comprised a larger fraction of the inhibitory neuron population than any of the other ensembles (F3,12 = 26.17, p = 0.000015) (n = 5 mice). Notably, this effect was apparent in the line graph not only at a 10% cutoff but at neighbouring cutoffs as well. C) Here, we asked a similar question as in Extended Data Fig. 6b, but instead asking what fraction of inhibitory neurons made up each ensemble. In this case, the number of cells was a fraction of the total ensemble size. In the line graph (left), we again parametrically varied the fraction of cells that were putative inhibitory neurons along the x-axis, and asked what fraction of each ensemble was comprised of inhibitory neurons. Again, we took the 10% mark—based on anatomical data—and compared the fraction of inhibitory neurons that made up each ensemble. Similar to in Extended Data Fig. 6b, the Overlap ensemble was composed more of inhibitory neurons than the other ensembles were (F3,12 = 15.29, p = 0.0002) (n = 5 mice). Collectively, this suggests that the Overlap ensemble is enriched in inhibitory neurons. D) Lack of periodicity of bursts during the offline period, as in Extended Data Fig. 3p,q (n = 5 mice). E) Decrease in locomotion around bursts during the offline period, as in Fig. 2d,e (n = 5 mice). F) Independent ensemble participation, as in Fig. 4b. Overlap ensemble participation is higher than Aversive participation (t4 = 6.1, p = 0.01) and is trending to be higher than Neutral participation (t4 = 2.55, p = 0.063). Neutral participation is higher than Aversive participation (t4 = 3.55, p = 0.036) (n = 5 mice). G) Ensemble coincident participation, as in Fig. 4e and Extended Data Fig. 4l. Overlap x Neutral participation is higher than Overlap x Aversive (F3,12 = 18.99, p = 0.0077; t4 = 12.17, p = 0.0009), replicating the previous result in Fig. 4e (n = 5 mice). H) Ensemble participation in Offline 2 bursts, as a function of the cell’s response during Inhibitory Tag, by each 5% of cells. Cells that were most active during Inhibitory Tag (leftmost points) participated more frequently in bursts than cells that responded less during Inhibitory Tag (F9,36 = 7.57, p = 0.000004) (n = 5 mice). I) SVM decoding of Neutral vs Aversive encoding context using cells active during both Neutral and Aversive encoding. Accuracy of decoding is significantly higher than shuffled controls (t4 = 10.04, p = 0.0006) (n = 5 mice). J) SVM decoding of Neutral vs Aversive encoding is no different when using 20% of cells, based on the cells’ response during Inhibitory Tag (F4,16 = 1.50, p = 0.28). This suggests that the putative inhibitory neurons hold no more or less predictive power than the rest of the population. All decoders performed better than shuffled controls (F1,4 = 64.13, p = 0.001). There is no interaction (F4,16 = 1.44, p = 0.29) (n = 5 mice).

