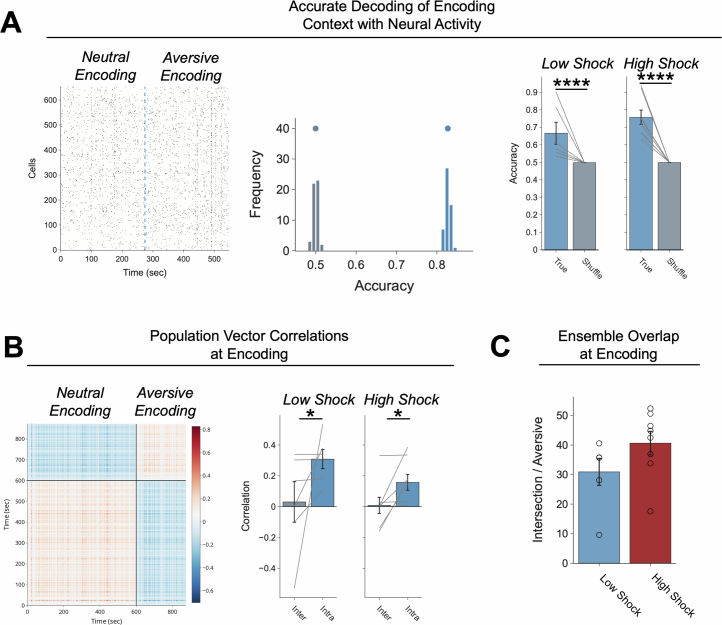
Extended Data Fig. 7. Neutral and Aversive contexts are discriminable at encoding.
A) Left: Example raster of activity of cells during Neutral and Aversive encoding. Cells that were cross-registered during both sessions were aligned, concatenated, and labelled with the context they were associated with. Support vector machines (SVMs) were trained on this activity (see Methods for details). Middle: Example distributions of accuracy using the true data (in blue) and using shuffled label controls (in grey). The dots above the distributions represent the mean accuracy of the distribution. Right: Quantification of accuracy between True vs Shuffle in low- and high-shock mice. Accuracy of the True data was significantly higher than Shuffle in both low- and high-shock groups (F1,12 = 38.49, p = 0.000046), and there was no difference in low- and high-shock mice (F1,12 = 0.015, p = 0.22) and no interaction (F1,12 = 0.014, p = 0.23) (low-shock, n = 6 mice; high-shock, n = 8 mice). B) Left: Example of population vector correlations within and between Neutral and Aversive encoding. Cells across sessions were again aligned and concatenated, as in Extended Data Fig. 7a. Then moment-to-moment correlation matrices were constructed to compare population activity within (intra) and between (inter) encoding sessions. Right: Quantification of population vector correlations within and between sessions. Intra-session correlations were higher than Inter-session correlations (F1,12 = 6.74, p = 0.02). There was no effect of Amplitude (F1,12 = 1.50, p = 0.24) or Interaction (F1,12 = 0.65, p = 0.44). Moreover, Intra-session correlations were significantly greater than 0 in low-shock (t5 = 5.00, p = 0.016) and high-shock (t7 = 3.08, p = 0.036), whereas Inter-session correlations were not significantly greater than 0 in low-shock (t5 = 0.23, p = 0.88) or high-shock (t7 = 0.15, p = 0.88). (low-shock, n = 6 mice; high-shock, n = 8 mice). C) Ensemble overlap between Neutral and Aversive encoding in low- vs high-shock mice. There was no difference in ensemble overlap between Neutral and Aversive encoding in low- vs high-shock mice (t11.43, p = 0.13) (low-shock, n = 6 mice; high-shock, n = 8 mice).

