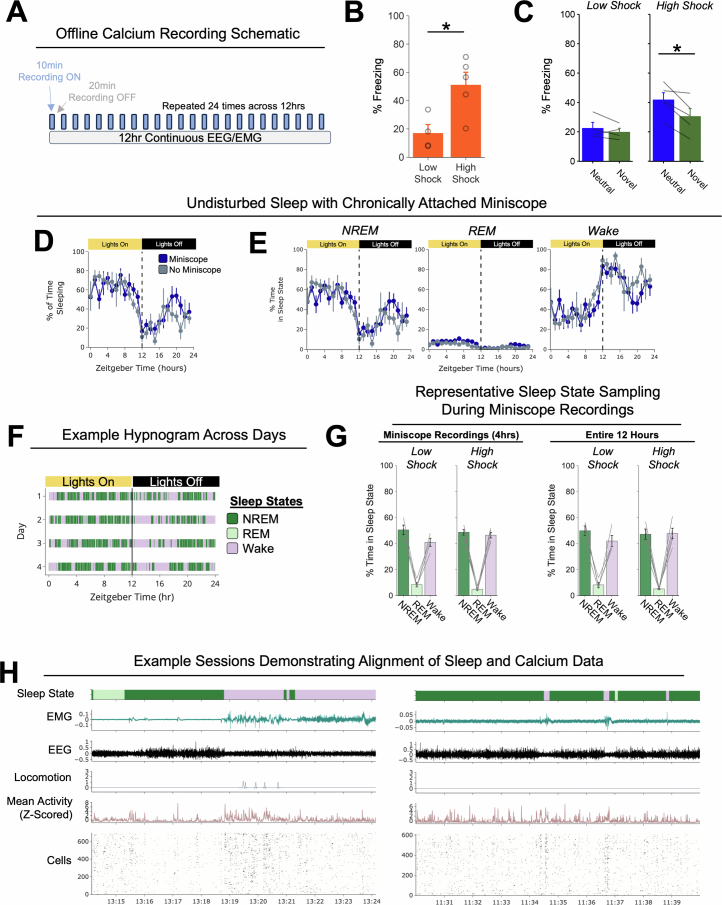
Extended Data Fig. 9. Validation of simultaneous calcium imaging and EEG/EMG to measure ensemble reactivation across sleep states.
A) Schematic representing the protocol for calcium imaging and EEG/EMG recordings during the offline period. EEG and EMG were recorded continuously throughout the offline period. To avoid photobleaching, calcium imaging was done intermittently: calcium was recorded for 10 min, followed by 20 min of no recording, repeated 24 times, for 4 hrs worth of calcium recordings across a 12 hr period. Mice underwent the retrospective memory-linking behavioural paradigm as in Fig. 1d, with calcium imaging recordings during Neutral and Aversive encoding, as well as during Aversive, Neutral, and Novel recall. During Offline 1 and Offline 2, in contrast to in Fig. 1d, these mice underwent the recording scheme described above. B) Freezing during Aversive recall. High-shock mice froze more during Aversive recall than low-shock mice (t7 = 8.99, p = 0.020) (low-shock, n = 4 mice; high-shock, n = 5 mice). C) Freezing during Neutral vs Novel recall. High-shock mice froze more during Neutral vs Novel recall (t4 = 4.02, p = 0.03), whereas low-shock mice froze no differently in Neutral vs Novel recall (t3 = 1.08, p = 0.36) (low-shock, n = 4 mice; high-shock, n = 5 mice). D) Mice wearing a Miniscope chronically throughout the experiment display no differences in sleep duration across the 24 hr sleep/wake cycle, compared to mice with no Miniscope implant (F1,10 = 0.54, p = 0.48) (Miniscope, n = 8 mice; No Miniscope, n = 4 mice). E) Same as Extended Data Fig. 9d but broken up by sleep state. Mice wearing a Miniscope chronically show no differences in time spent in each sleep state. F) Example hypnogram demonstrating that mice display normal patterns of sleep, with more bouts of sleep during their Lights On period. G) The calcium imaging recording scheme in Extended Data Fig. 9a reliably captures the fractions of time that mice spend in each sleep/wake state. Left: Amount of time spent in each sleep state as captured during the Miniscope recordings across a 12 hr period (4hrs of total calcium recording time). Right: Amount of time spent in each sleep state across the entire 12hrs of the offline period (low-shock, n = 4 mice; high-shock, n = 5 mice). H) Example sessions demonstrating alignment of sleep and calcium data. Left: Example session where mouse awakens halfway throughout the recording. Right: Example session where mouse is mostly asleep but has three brief arousals.

