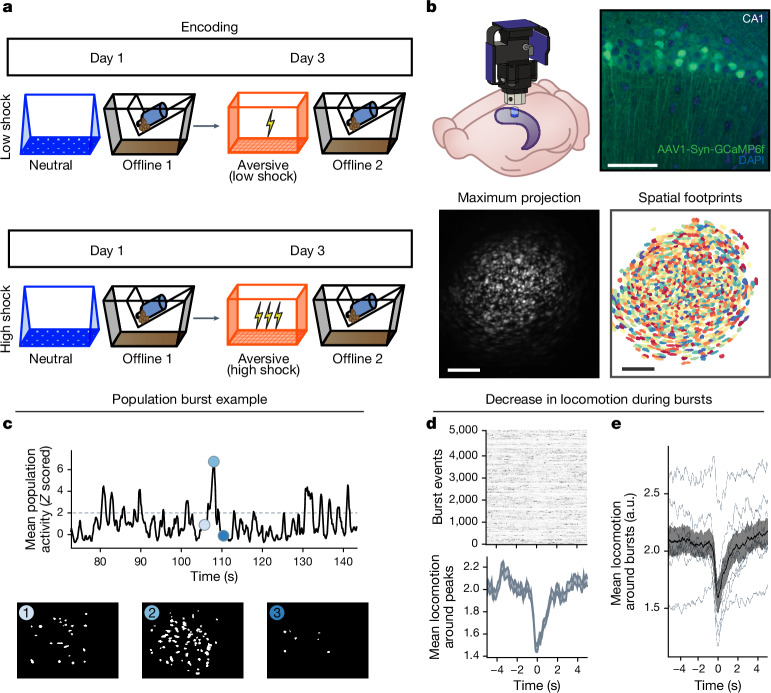
Fig. 2. Hippocampal ensembles exhibit population bursts of calcium events during offline periods.
a, Behavioural schematic of the retrospective memory-linking experimental design. The same as in Fig. 1d, but focusing here on the offline periods. b, Schematic of the lens and Miniscope placement onto the dorsal hippocampus (top left). Top right, representative histological analysis of GCaMP6f expression in the hippocampal CA1, imaged using confocal microscopy. Green, AAV1-Syn-GCaMP6f expression; blue, cellular DAPI stain. Bottom left, maximum-intensity projection of an example mouse across one recording session. Bottom right, spatial footprints of all recorded cells during the session on the left randomly colour coded. This experiment was repeated across two cohorts. Scale bars, 50 μm (top) and 200 μm (bottom). c, Example of a burst event. The top trace represents the z-scored mean population activity within one of the offline recordings. Three timepoints were chosen (overlaid in circles), the middle representing the peak of a burst event and the timepoints to its left and right representing t − 2 s and t + 2 s from the peak, respectively. The bottom three matrices represent binarized spatial footprints depicting the spatial footprints of the cells sufficiently active to participate in a burst (z > 2). The matrices represent the timepoints of the three datapoints above it, ordered by time. d, Locomotion of an example mouse during each burst event stacked along the y axis (top), and the mean locomotion around burst events (bottom). Mice showed a robust and brief slowing down around 1 s before each burst event, before increasing locomotion back up around 2 s later. e, Mouse locomotion as in d, but averaged across all of the mice. Each thin line represents one mouse, and the thick black line represents the mean across mice, with the grey ribbon around it representing the s.e.m. n = 8 mice. This demonstrates a robust and reliable decrease in locomotion around the onset of burst events. From the experiment in Extended Data Fig. 3. Error bands indicate s.e.m.

