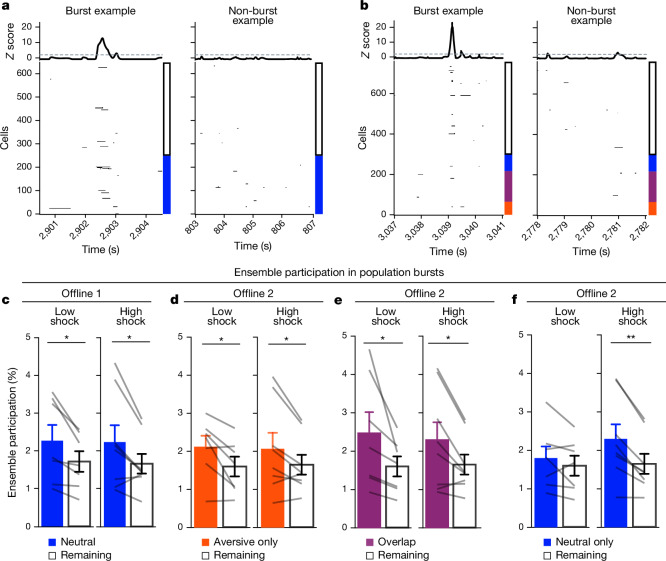
Fig. 3. A strong aversive experience recruits the past neutral ensemble into offline population bursts.
a, Example offline 1 burst event (left). Each row represents the activity of a neuron, colour coded by ensemble (blue, neutral; white, remaining). The top black trace represents the z-scored mean population activity. Right, example non-burst event. b, The same as in a but for offline 2 (red, aversive; purple, overlap; blue, neutral; white, remaining). c, During offline 1 in the low- and high-shock groups, a greater percentage of the neutral ensemble participated in bursts than the remaining ensemble (ensemble: F1,13 = 16.33, P = 0.001; amplitude: F1,13 = 0.009, P = 0.925; ensemble × amplitude: F1,13 = 0.0058, P = 0.940). n = 7 (low-shock) and n = 8 (high-shock) mice. d, During offline 2 in the low- and high-shock groups, a greater percentage of the aversive ensemble participated in bursts than the remaining ensemble (ensemble: F1,13 = 13.57, P = 0.0028; amplitude: F1,13 = 0.000078, P = 0.99; ensemble × amplitude: F1,13 = 0.16, P = 0.69). n = 7 (low-shock) and n = 8 (high-shock) mice. e, During offline 2 in the low- and high-shock groups, a greater percentage of the overlap ensemble participated in bursts than the remaining ensemble (ensemble: F1,13 = 13.95, P = 0.0025; amplitude: F1,13 = 0.014, P = 0.91; ensemble × amplitude: F1,13 = 0.31, P = 0.58). n = 7 (low-shock) and n = 8 (high-shock) mice. f, During offline 2, neutral and remaining ensembles differentially participated in bursts in the high- and low-shock groups (ensemble × amplitude: F1,13 = 5.186, P = 0.040). High-shock mice showed higher neutral ensemble participation relative to the remaining ensemble (t7 = 4.88, P = 0.0036), low-shock mice showed no difference in ensemble participation (t6 = 1.33, P = 0.23). n = 7 (low-shock) and n = 8 (high-shock) mice. **P < 0.01. Error bars indicate s.e.m.

