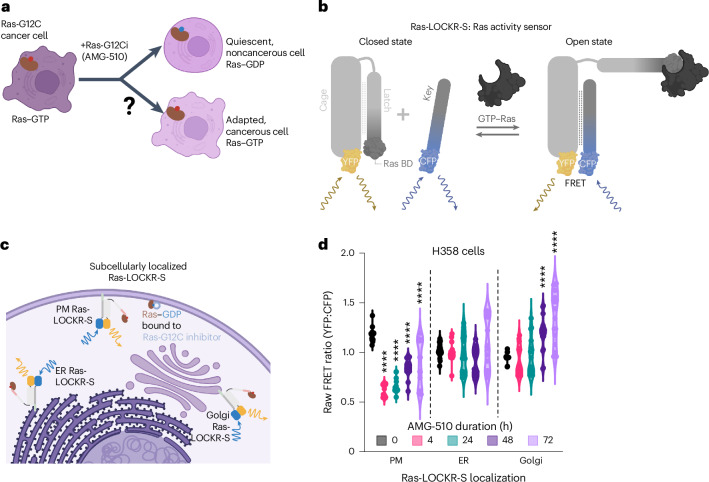
Fig. 1. Ras-G12C–GDP inhibitor (AMG-510) treatment leads to Golgi-localized Ras activity.
a, Schematic showing the question being studied: How does Ras-G12C inhibition lead to adaptive signaling and drug resistance? b, Schematic of Ras-LOCKR-S, a genetically encoded biosensor for measuring endogenous Ras activity. c, Schematic of localized Ras-LOCKR-S at three subcellular regions. d, Raw FRET ratios (YFP–CFP) of localized Ras-LOCKR-S in H358 cells treated for the times indicated with 100 nM AMG-510 (n = 17 cells per condition). PM, CV at 0 h = 5.7%, 4 h = 10%, 24 h = 11%, 48 h = 11% and 72 h = 26%; ER, CV at 0 h = 7%, 4 h = 9.4%, 24 h = 19%, 48 h = 15% and 72 h = 23%. Golgi, CV at 0 h = 4.6%, 4 h = 16%, 24 h = 19%, 48 h = 15% and 72 h = 19%. Statistical analysis was conducted using an ordinary two-way ANOVA. *P value comparison to the 0-h time point, from left to right: PM, 1.4 × 10⁻⁷, 3.5 × 10⁻⁷, 4.5 × 10⁻⁶ and 7.8 × 10⁻⁵; Golgi, 3.8 × 10⁻⁵ and 1.2 × 10⁻⁵.

