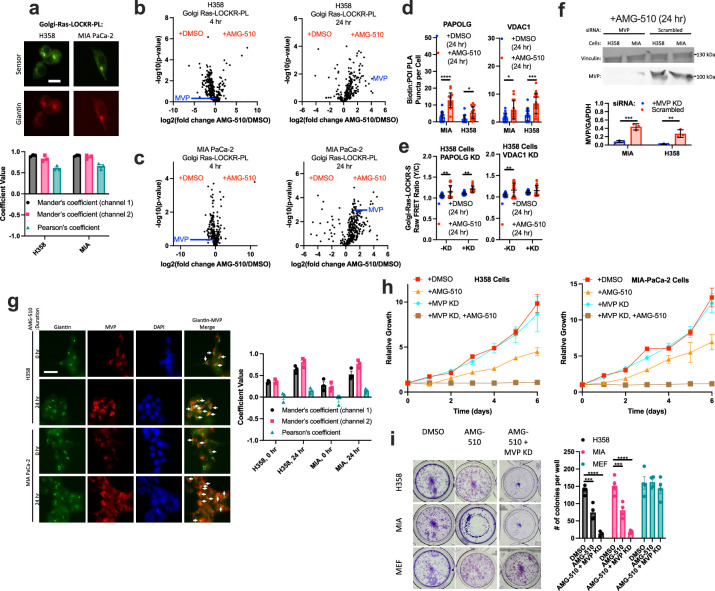
Extended Data Fig. 5. MVP facilitates AMG-510-dependent oncogenic signaling and cell growth.
(a) Top: Representative images from three biological replicates of H358 or MIA PaCa-2 cells transfected with golgi-localized Ras-LOCKR-PL and immunostained for giantin. Bottom: Co-localization analysis between golgi-Ras-LOCKR-PL Key and giantin (n = 3 experiments). Scale bar = 10 μm. (b,c) Volcano plots of MS results of H358 (b) or MIA PaCa-2 (c) cells expressing localized Ras-LOCKR-PL and incubated for 24 hours with 500 μM biotin and either with 100 nM AMG-510 or DMSO. X-axis is log2ratio of protein intensities between cells treated with AMG-510 versus DMSO for 4 hours or for 24 hours. Y-axis is student’s two-way t-test p-value (see Methods). (d) MIA PaCa-2 or H358 cells were transfected with golgi-localized Ras-LOCKR-PL, incubated with 500 μM biotin and either with DMSO or 100 nM AMG-510, and underwent PLA (n = 16 cells). The number of PLA puncta per cell are shown. Each dot represents a single cell. Statistics: Student’s two-way t-test. *p-values, left to right: 8.7 × 10⁻⁸,, 0.033, 0.02, 5.1 × 10⁻⁴. (e) Raw FRET ratios of H358 cells transfected with either no siRNA or MVP siRNA and then Ras-LOCKR-S, followed by treatment with 100 nM AMG-510 or DMSO for 24 hours (n = 17 cells per condition). Statistics: Student’s two-way t-test. *p-values, left to right: 7.1 × 10⁻³, 5.9 × 10⁻³, 6.9 × 10⁻³. (f) Representative immunoblot of MIA PaCa-2 or H358 cells transfected with MVP or scrambled siRNA for 2 days and subsequently treated with 100 nM AMG-510 for 24 hours (n = 3 experiments). Statistics: Student’s two-way t-test. *p-values, left to right: 7.1 × 10⁻⁴, 1.5 × 10⁻³. (g) Left: Representative images of H358 and MIA PaCa-2 cells treated without or with 100 nM AMG-510 and immunostained for MVP and giantin. Right: Colocalization analysis between giantin and MVP (n = 3 experiments). Scale bar = 10 μm. (h) Cell growth curves of H358 (left) or MIA PaCa-2 (right) cells transfected either with no siRNA or MVP siRNA followed by treatment with 100 nM AMG-510 or DMSO (n = 3 experiments). (i) Representative images of colony formation assay of H358, MIA PaCa-2, or MEF transfected either with no siRNA or MVP siRNA followed by treatment either with DMSO or 100 nM AMG-510 (n = 3 experiments). Statistics: Ordinary two-way ANOVA. *p-values, left to right: 5.1 × 10⁻⁴, 2.2 × 10⁻⁷, 8.7 × 10⁻⁴, 8.5 × 10⁻⁶. For all, bars or lines represent average and error bars represent s.e.m.

