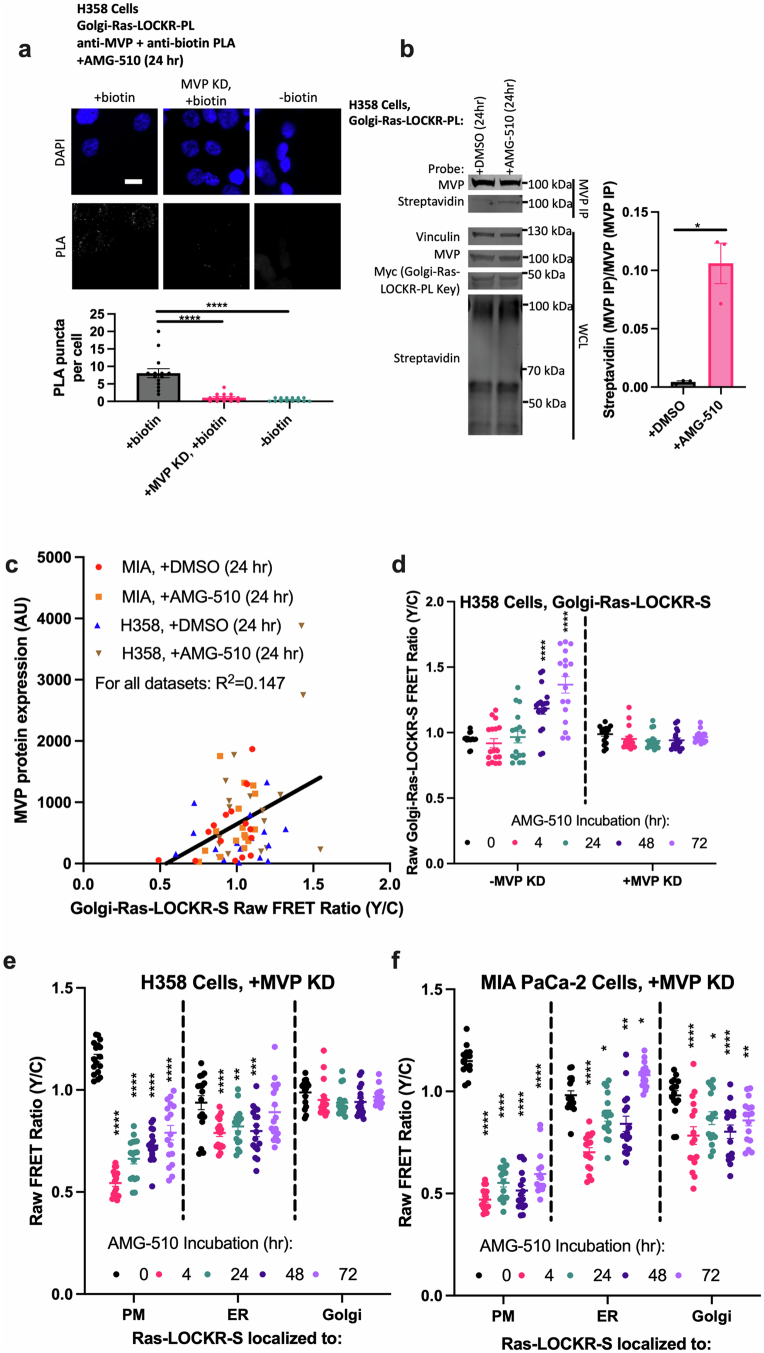
Extended Data Fig. 6. MVP at the golgi-Ras signalosome typifies the AMG-510-promoted signaling adaptive cell subpopulation.
(a) Top: Representative epifluorescence images from three biological replicates of H358 transfected with either no or MVP siRNA and then golgi-localized Ras-LOCKR-PL, treated with 100 nM AMG-510 for 1 day, and either treated also with 500 μM biotin, treated either with 500 μM biotin or DMSO. Cells then were fixed and subjected to PLA using anti-MVP and anti-biotin. Bottom: Bar graph quantifying number of PLA puncta per condition (n = 14 cells). Scale bar = 10 μm. Statistics: Student’s two-way t-test. *p-values, left to right: 7.1 × 10⁻⁷, 6.1 × 10⁻⁶. (b) Left: Representative immunoblot of three biological replicates of H358 cells transfected with golgi-Ras-LOCKR-PL, treated with either DMSO or 100 nM AMG-510 for 24 hours, and then subjected to MVP pull down. Right: Bar graph quantifying the amount of biotinylated MVP over total amount of MVP (n = 3 experiments). Statistics: Student’s two-way t-test. *p-value: 0.011. (c) Scatterplot comparing MVP expression by immunostaining (y-axis) to golgi-Ras-LOCKR-S raw FRET ratios (x-axis). MIA PaCa-2 or H358 cells were transfected with golgi-Ras-LOCKR-S, treated either with DMSO or 100 nM AMG-510 for 24 hours, immunostained, and then imaged. Each dot represents a single cell where both measurements were done in fixed cells (n = 16 cells per condition, 64 cells in total). (d) Raw FRET ratios in H358 cells transfected either with scrambled or MVP siRNA and then golgi-Ras-LOCKR-S, followed by subsequent treatment over time with 100 nM AMG-510 (n = 17 cells per condition). The 0 and 72 hour dataset is also shown in Fig. 3d. Statistics: Ordinary two-way ANOVA, comparison to 0 hour AMG-510 time point. *p-values are comparison to 0 hour time point, left to right: 3.3 × 10⁻⁶, 4.1 × 10⁻⁶. (e,f) Raw FRET ratios of subcellularly localized Ras-LOCKR-S in either H358 (e) or MIA PaCa-2 (f) cells transfected MVP siRNA prior to Ras-LOCKR-S transfection, followed by treatment over time with 100 nM AMG-510 (n = 17 cells per condition). The H358 golgi datasets are the same as shown in Fig. 3d and Extended Data Fig. 6d. Statistics: Ordinary two-way ANOVA. *p-values are comparison to 0 hour point, left to right: (e) PM: 5.1 × 10⁻⁶, 3.3 × 10⁻⁷, 8.1 × 10⁻⁶, 5.6 × 10⁻⁵, ER: 8.1 × 10⁻⁸, 5.1 × 10⁻³, 7.7 × 10⁻⁴, (f) PM: 5.6 × 10⁻⁷, 5.6 × 10⁻⁶, 7.1 × 10⁻⁷, 8.1 × 10⁻⁵, ER: 1.5 × 10⁻⁶, 0.018, 4.4 × 10⁻³, 0.019, Golgi: 6.1 × 10⁻⁵, 0.012, 7.3 × 10⁻⁵, 5.3 × 10⁻³. For all, bars represent average and error bars represent s.e.m.

