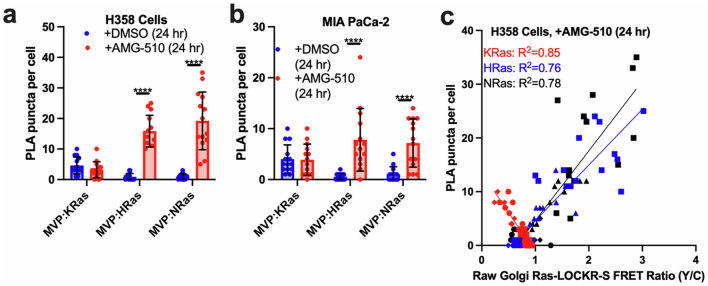
Extended Data Fig. 7. MVP co-localizations with Ras isoforms change during AMG-510 inhibition.
(a-c) H358 (a) or MIA PaCa-2 (b) cells transfected with golgi-Ras-LOCKR-S and then treated with either DMSO or 100 nM AMG-510 for 24 hours were probed for MVP:Ras isoform co-localization via PLA. PLA puncta per cell for MVP:Ras isoforms in H358 (a) and MIA PaCa-2 (b) cells. Bars represent average from three biological replicates and error bars represent s.e.m. and (c) correlation between golgi-Ras-LOCKR-S raw FRET ratios and PLA puncta (anti-MVP, anti-KRas, anti-HRas, anti-NRas) per cell (n = 14 cells per condition, n = 42 cells in total per cell line). The same dataset in Extended Data Fig. 7c is shown in Extended Data Fig. 7a, b. Statistics: Student’s two-way t-test. *p-values, from left to right: 4.5 × 10⁻⁵, 5 × 10⁻⁷, 8.3 × 10⁻⁶, 5.6 × 10⁻⁶.

