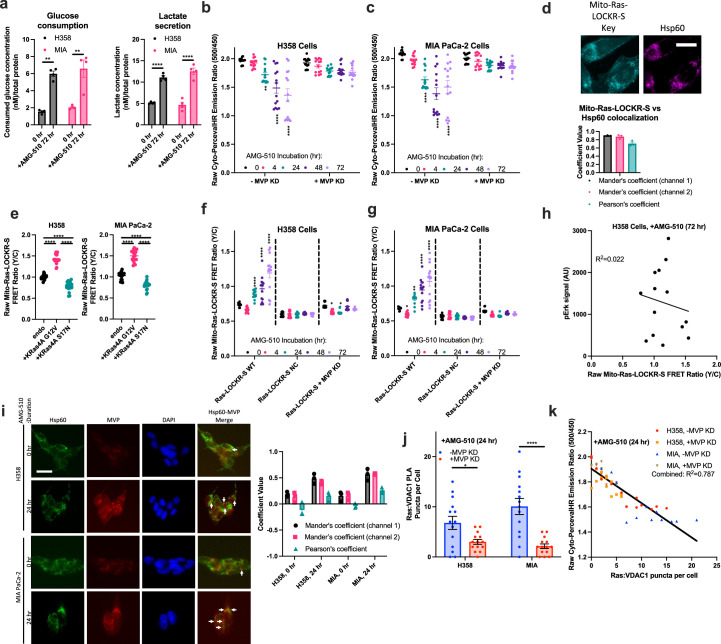
Extended Data Fig. 8. MVP is necessary for metabolic changes during AMG-510 treatment.
(a) Glucose consumption and lactate release in untreated H358 and MIA PaCa-2 cells or treated with 100 nM AMG-510 for 24 h (n = 4 experiments). Statistics: student’s two-way t-test. *p-values, left to right: 6.4 × 10⁻³, 6.2 × 10⁻³, 5.7 × 10−5,6.6 × 10−6. (b,c) Raw emission ratios of H358 (b) or MIA PaCa-2 (c) cells transfected with either scrambled or MVP siRNA and then cyto-PercevalHR, followed by treating with 100 nM AMG-510 for the time indicated (n = 14 cells per condition). Statistics: Ordinary two-way ANOVA. *p-values are comparison to 0-hour time point, left to right: (b) 5.1 × 10⁻³, 6.3 × 10⁻⁷, 8 × 10⁻⁷, (c) 5.5 × 10⁻⁵, 4.8 × 10⁻⁶, 5.7 × 10⁻⁷. (d) Top: Representative image of H358 cells transfected with mito-Ras-LOCKR-S and immunostained for Hsp60. Bottom: Co-localization analysis between mito-Ras-LOCKR-S Key and Hsp60 (n = 3 experiments). Scale bar = 10 μm. (e) Raw FRET ratios of H358 and MIA PaCa-2 cells transfected with mito-Ras-LOCKR-S and either transfected with nothing else, KRas4A G12V or S17N11 (n = 20 cells per condition). Statistics: Ordinary two-way ANOVA. *p-values, left to right: 5.5 × 10⁻⁶, 8.1 × 10⁻¹⁰, 7.2 × 10⁻⁶, 8.5 × 10⁻⁷, 9.1 × 10⁻¹¹, 3.2 × 10⁻⁶. (f,g) Raw FRET ratios of H358 (f) or MIA PaCa-2 (g) transfected with either mito-Ras-LOCKR-S WT, mito-Ras-LOCKR-S NC, or MVP siRNA and then mito-Ras-LOCKR-S WT, followed by 100 nM AMG-510 treatment for the times indicated (n = 14 cells per condition). Statistics: Ordinary two-way ANOVA. *p-values are comparison to 0-hour time point, left to right: (f) 5.3 × 10⁻⁵, 6.1 × 10⁻⁶, 1.4 × 10⁻⁶, 0.044, 0.04 (g) 0.041, 3.3 × 10⁻³,−51.3 × 10⁻⁶, 7.5 × 10⁻⁷. (h) Single-cell scatterplot comparing mito-Ras-LOCKR-S raw FRET ratio to pErk immunostaining fluorescence in H358 cells treated with 100 nM AMG-510, fixed, immunostained, and imaged. (n = 14 cells). (i) Left: Representative images of H358 or MIA PaCa-2 cells treated with or without 100 nM AMG-510 and immunostained for MVP and Hsp60. Right: Co-localization analysis between MVP and Hsp60 (n = 3 experiments). Scale bar = 10 μm. (j,k) H358 or MIA PaCa-2 cells transfected with scrambled siRNA or MVP siRNA and subsequently transfected with Cyto-PercevalHR, treated with 100 nM AMG-510, fixed underwent PLA analysis (anti-pan-Ras, anti-VDAC1), and then imaged. (j) Quantifications of MVP:VDAC1 PLA per cell. (k) Single-cell scatterplot comparing cyto-PercevalHR emission ratios and Ras:VDAC1 PLA puncta per cell (n = 14 cells per condition). The same datasets were used in j,k. Statistics: Student’s two-way t-test. *p-values, left to right: 0.015, 6 × 10⁻⁶. For all, bars represent average and error bars represent s.e.m. Shared datasets between: Fig. 5e/Extended Data Fig. 8b, Fig. 5f/Extended Data Fig. 8f.

