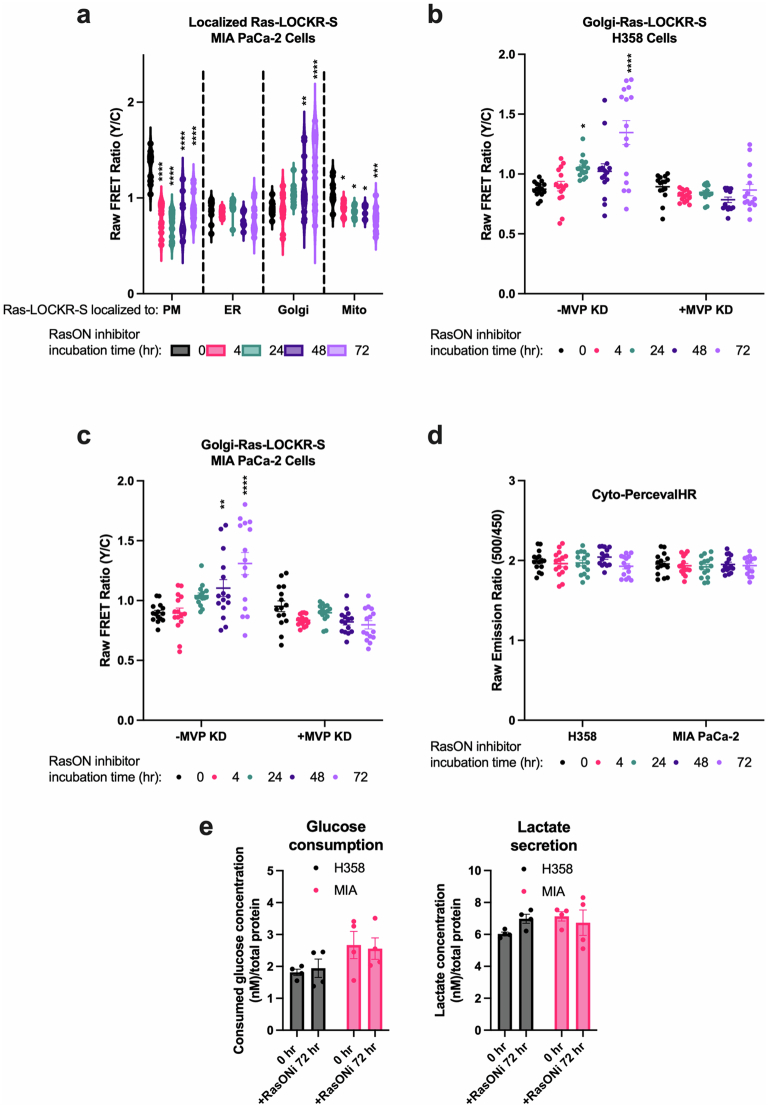
Extended Data Fig. 9. RasONi treatment induces compensatory oncogenic signaling that is dependent on MVP.
(a) Raw FRET ratios of MIA PaCa-2 cells transfected with subcellularly localized Ras-LOCKR-S and treated over time with 100 nM RasONi (n = 15 cells per condition). Statistics: PM: CV at 0 hour = 12%, 4 hour = 19%, 24 hour = 18%, 48 hour = 28%, 72 hour = 18%. ER: CV at 0 hour = 12%, 4 hour = 5.2%, 24 hour = 8.6%, 48 hour = 10%, 72 hour = 19%. Golgi: CV at 0 hour = 8.6%, 4 hour = 18%, 24 hour = 8.8%, 48 hour = 26%, 72 hour = 28%. Mito: CV at 0 hour = 13%, 4 hour = 8.1%, 24 hour = 6.8%, 48 hour = 8.1%, 72 hour = 15%. Ordinary two-way ANOVA. *p-values are comparison to 0 hour time point, from left to right: PM: 7.2 × 10⁻⁷, 6.5 × 10⁻⁶, 4.3 × 10⁻⁵, 2.1 × 10⁻⁵, Golgi: 7.2 × 10⁻³, 6 × 10⁻⁶, Mito: 0.035, 0.031, 0.027, 3.4 × 10⁻⁴. (b-c) Raw FRET ratios of H358 (b) or MIA PaCa-2 (c) cells transfected either with scrambled or MVP siRNA for 2 days, then subsequently transfected with golgi-Ras-LOCKR-S, and treated over time with 100 nM RasONi (n = 15 cells per condition). Dataset in Extended Data Fig. 9b is the same as the one used in Fig. 6d. Statistics: Ordinary two-way ANOVA. *p-values are comparison to 0 hour time point, from left to right: (b) 0.042, 5.1 × 10⁻⁵, (c) 8.7 × 10⁻³, 2.9 × 10⁻⁵. (d) Raw emission ratios of H358 and MIA PaCa-2 cells transfected with cyto-PercevalHR and treated over time with 100 nM RasONi (n = 15 cells per condition). (e) H358 and MIA PaCa-2 cells were measured via commercial asays for glucose consumption and lactate release before or 72 hours after 100 nM RasONi addition (n = 4 experiments). Bars represent average from four biological replicates and error bars represent s.e.m.

