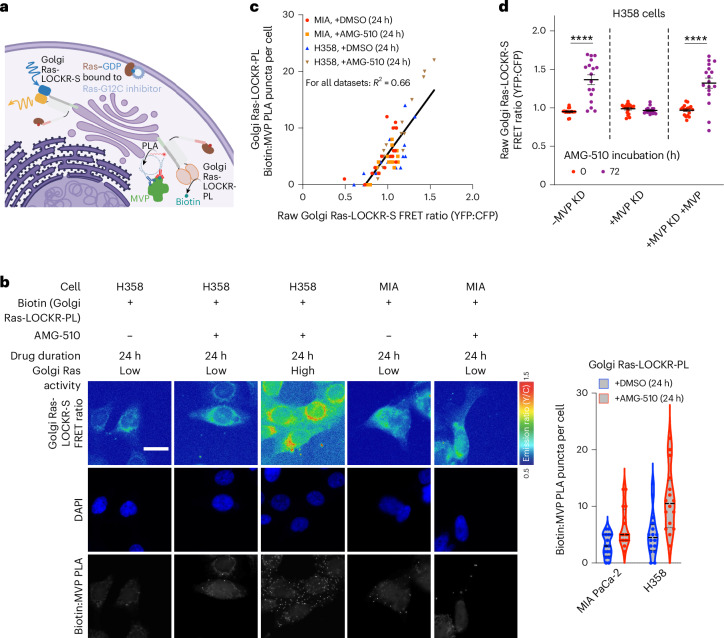
Fig. 3. MVP at the Golgi facilitates the AMG-510-promoted signaling adaptive cell subpopulation.
a, Schematic of the single-cell experiment relating Golgi Ras activity with the Golgi Ras signalosome. Golgi Ras-LOCKR-PL with PLA and Golgi Ras-LOCKR-S were used to relate MVP’s presence in the Golgi Ras signalosome to Golgi Ras activity, respectively, in response to AMG-510 treatment. b, Left, representative epifluorescence images from three biological replicates of H358 and MIA PaCa-2 cells expressing Golgi Ras-LOCKR-PL and Golgi Ras-LOCKR-S. Cells were cotreated with 500 μM biotin and either DMSO or 100 nM AMG-510 for 24 h. Cells were then fixed, subjected to PLA using anti-biotin and anti-MVP antibodies for PLA and then imaged for PLA puncta and FRET ratios. Right, violin plot comparing PLA puncta per cell (n = 16 cells). Each dot represents a single cell. The same dataset was used in Fig. 2c. CV for MIA PaCa-2 − AMG-510 = 66%, CV for MIA PaCa-2 + AMG-510 = 77%, CV for H358 − AMG-510 = 54% and CV for H358 + AMG-510 = 50%. Scale bar = 10 μm. c, Scatterplot comparing Golgi Ras-LOCKR-PL-mediated labeling of MVP (y axis) to Golgi Ras-LOCKR-S raw FRET ratios (x axis) in MIA PaCa-2 and H358 cells treated with DMSO or AMG-510 for 24 h. Each dot represents a single cell where both measurements were performed (n = 16 cells per condition). d, Raw FRET ratios of Golgi Ras-LOCKR-S in H358 cells transfected with MVP siRNA, scrambled siRNA or MVP siRNA followed by transfection with ectopic MVP 48 h later. Raw FRET ratios for 0 and 72 h treatment with 100 nM AMG-510 are shown (n = 17 cells per condition). Statistical analysis was conducted using a Student’s two-way t-test. P values, from left to right: 8.3 × 10⁻⁶ and 5.4 × 10⁻⁶.

