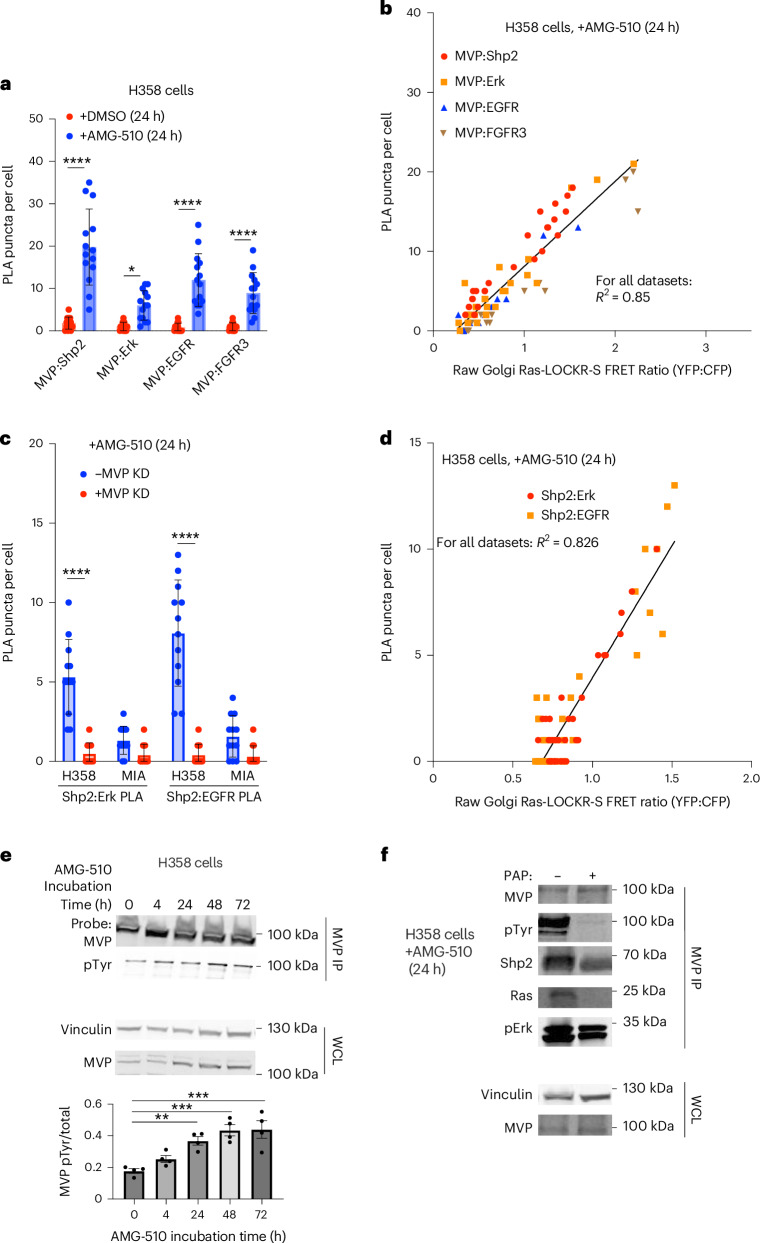
Fig. 4. Single-cell signaling analysis shows that MVP colocalization with MAPK pathway components facilitates the AMG-510-promoted signaling adaptive cell subpopulation.
a,b, H358 or MIA PaCa-2 cells were transfected with Golgi Ras-LOCKR-S and treated with DMSO or 100 nM AMG-510 for 24 h. Cells were then fixed and probed for MVP–MAPK pathway component proximity with PLA. Quantifications of different MVP–MAPK colocalizations (number of puncta per cell) (a) and the correlation between Golgi Ras-LOCKR-S raw FRET ratios and PLA puncta (anti-MVP and anti-MAPK pathway component) in cells (b) (n = 14 cells per condition). The same datasets were used in a,b. Statistical analysis was conducted using a Student’s two-way t-test. *P values, from left to right: 5.1 × 10⁻⁶, 0.032, 7.1 × 10⁻⁶ and 1.3 × 10⁻⁶. c,d, H358 or MIA PaCa-2 cells were transfected with MVP or scrambled siRNA, 2 days later transfected with Golgi Ras-LOCKR-S,and then incubated with 100 nM AMG-510 for 24 h. Cells were then fixed and underwent PLA analysis to probe for Shp2–Erk and Shp2–EGFR colocalization. Quantifications of Shp2–Erk and Shp2–EGFR interactions (number of punta per cell) (c) and correlation between Golgi Ras-LOCKR-S FRET ratios and PLA puncta (anti-Shp2, anti-Erk and anti-EGFR) in cells (d) (n = 12 cells per condition). The same datasets were used in c,d. Statistical analysis was conducted using a Student’s two-way t-test. P values, from left to right: 2.5 × 10⁻⁶ and 5.2 × 10⁻⁷. e, H358 cells were treated with 100 nM AMG-510 for 72 h followed by lysis, MVP immunoprecipitation and immunoblotting for total MVP and phosphorylated tyrosine levels. Top, representative immunoblots of immunoprecipitated (top) and whole-cell lysate samples (bottom). Bottom, densitometry quantification of immunoblots showing the ratio of MVP with the phosphorylated tyrosine modification (pTyr:MVP) (n = 4 biological replicates). The bar represents the average of four replicates and error bars represent the s.e.m. Statistical analysis was conducted using a Student’s two-way t-test. *P values, from left to right: 3.2 × 10⁻³, 8.7 × 10⁻⁴ and 4.4 × 10⁻⁴. f, H358 cells were treated with 100 nM AMG-510 for 24 h followed by lysis, incubation with or without PAP for 45 min, immunoprecipitation of MVP and immunoblotting for levels of coimmunoprecipitated Shp2, Ras and pErk. Representative immunoblots are shown with immunoprecipitation samples (top) and whole-cell lysate samples (bottom) (n = 3 experiments).

