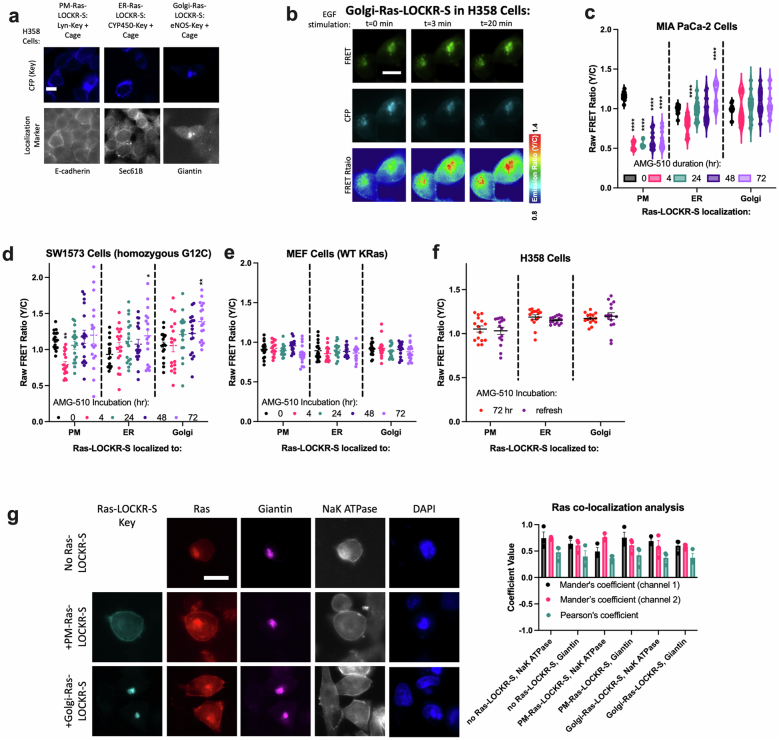
Extended Data Fig. 2. AMG-510 treatment leads to Ras activation at the golgi.
(a) Representative epifluorescence images from three biological replicates of H358 cells transfected with subcellularly localized Ras-LOCKR-S and immunostained for respective localization markers. Localization sequences: PM = N-terminus of Lyn, ER = N-terminus of CYP450, Golgi=N-terminus of eNOS. Scale bar = 10 μm. (b) Representative images from three biological replicates of H358 cells transfected with golgi-Ras-LOCKR-S and stimulated with 100 ng/mL EGF. Shown are live cell epifluorescence images. YFP/CFP FRET channel on top, CFP channel on bottom, and pseudocolored FRET ratios on the bottom. Scale bar = 10 μm. (c–e) Raw FRET ratios of localized Ras-LOCKR-S in MIA PaCa-2 (c), SW1573 (d), or WT MEF (e) cells treated over time with 100 nM AMG-510 (n = 17 cells per condition). For MIA PaCa-2 data (c): PM: CV at 0 hour = 4.1%, 4 hour = 9.4%, 24 hour = 6.4%, 48 hour = 18%, 72 hour = 19%. ER: CV at 0 hour = 5.2%, 4 hour = 14%, 24 hour = 12%, 48 hour = 15%, 72 hour = 13%. Golgi: CV at 0 hour = 7.4%, 4 hour = 18%, 24 hour = 16%, 48 hour = 14%, 72 hour = 16%. Statistics: Ordinary two-way ANOVA. *p-values are comparing to 0 hour AMG-510 time point: (c) PM: 3.2 × 10⁻⁶, 5.4 × 10⁻⁶, 4.1 × 10⁻⁵, 2.1 × 10⁻⁵, ER: 9.6 × 10⁻⁶, 5.4 × 10⁻⁶, (d) PM: 3.4 × 10⁻³, ER: 0.019, Golgi: 6.7 × 10⁻³. (f) Raw FRET ratios of localized Ras-LOCKR-S in H358 cells treated with 100 nM AMG-510 for 72 hours and then refreshed with 100 nM AMG-510 for another 2 hours (n = 15 cells per condition). (g) H358 cells either with no transfection, transfected with PM-Ras-LOCKR-S, or transfected with golgi-Ras-LOCKR-S were immunostained for Ras, giantin (golgi marker), and NaK ATPase (PM marker). Left: Representative epifluorescence images of fixed cells from three biological replicates. Right: Co-localization analysis measuring co-localization of endogenous Ras with the golgi and PM markers (n = 3 experiments). Scale bar = 10 μm.

