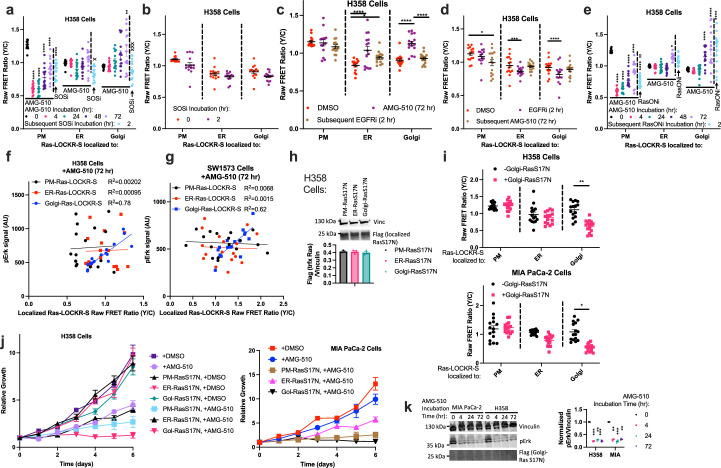
Extended Data Fig. 3. Effects of AMG-510-promoted golgi-localized Ras activity.
(a-e) Raw FRET ratios (Y/C) of H358 cells expressing localized Ras-LOCKR-S that were treated either (a) with 100 nM AMG-510 followed by 1μM Sos inhibitor (SOSi) BI-3406 (n = 17 cells per condition), (b) with 1μM Sos inhibitor BI-3406 (n = 14 cells per condition), (c) with 100 nM AMG-510 followed by 50μg/mL Cetuximab (EGFRi) (n = 17 cells per condition), (d) with 50μg/mL Cetuximab followed by 100 nM AMG-510 (n = 15 cells per condition), or (e) with 100 nM AMG-510 followed by 100 nM RasG12C-GTP (RasON) inhibitor (RasONi) RMC-6291 (e) (n = 14 cells per condition). Statistics: Ordinary two-way ANOVA. *p-values are comparison to 0 hour time point or as indicated, left to right: (a) PM: 5.1 × 10⁻⁸, 4.5 × 10⁻⁸, 2.5 × 10⁻⁶, 3.5 × 10⁻⁶, 9 × 10⁻⁷, Golgi: 8.7 × 10⁻³, (c) ER: 7.5 × 10⁻⁶, 0.031, Golgi: 4.3 × 10⁻⁶, 3.2 × 10⁻⁶, (d) PM: 0.035, ER: 1.5 × 10⁻⁴, Golgi: 8.1 × 10⁻⁵, (e) PM: 4.1 × 10⁻⁷, 9.7 × 10⁻⁷, 1.5 × 10⁻⁶, 8.3 × 10⁻⁷, 1.3 × 10⁻⁵, ER: 0.011, Golgi: 1.7 × 10⁻⁶, 9.1 × 10⁻⁸, 5.5 × 10⁻⁵. x is p-value comparing to 72 hour time point, left to right: (a) ER: 0.029, Golgi: 1.5 × 10⁻⁴, (e) PM: 7.7 × 10⁻³. (f,g) Scatterplot comparing localized Ras-LOCKR-S raw FRET ratio to pErk immunostaining fluorescence in H358 (f) or SW1573 (g) cells treated with 100 nM AMG-510. Each dot represents a single cell where cells were transfected, treated with AMG-510, fixed, immunostained with pErk antibody, and imaged (n = 17 cells per condition). (h) Top: Representative immunoblot of H358 cells stably expressing localized RasS17N (see Methods) (n = 3 experiments). Bottom: Densitometry analysis. (i) Raw FRET ratios of H358 or MIA PaCa-2 cells with or without stable expression of Golgi-RasS17N and transfected with localized Ras-LOCKR-S (n = 15 cells per condition). Imaging was 24 hours after transfection. Statistics: Ordinary two-way ANOVA. *p-value, top to bottom: 7.7 × 10⁻³, 0.029. (j) Cell growth curves of H358 (left) or MIA PaCa-2 (right) cells with or without stable expression of localized RasS17N and treatment with 100 nM AMG-510 or DMSO (n = 3 experiments). (k) Left: Representative immunoblot of MIA PaCa-2 or H358 cells stably expressing localized RasS17N and treated with 100 nM AMG-510 (n = 4 experiments). Right: Densitometry analysis. Data normalized to 0 hour time point. Statistics: Ordinary two-way ANOVA. *p-values are comparison to 0 hour time point, left to right: H358: 4 × 10⁻⁴, 3.5 × 10⁻³, 8.6 × 10⁻⁴, MIA PaCa-2: 3 × 10⁻³, 9.7 × 10⁻⁴, 6.4 × 10⁻³. For all, bars or lines represent average and error bars represent s.e.m.

