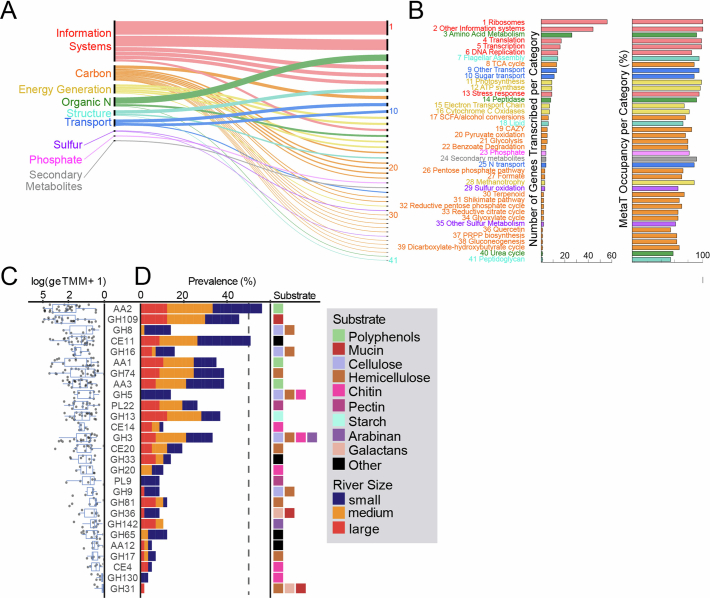
Extended Data Fig. 6. Gene level expression across rivers.
Genes detected in more than 50% of metatranscriptomes, with gene functions (n = 365) grouped by broad categories (n = 9, A) and refined to subcategories (n = 41, B). Thickness of lines and line order in A show the number of functions within a particular category (right) and subcategory (left). A and B are linked by subcategory number (1–41). For each of the 41 subcategories, the number of genes and occupancy defined as the percentage of samples detected across metatranscriptomes is shown by bar charts. Hypothetical and genes with unknown annotations are not shown, albeit 21 genes with these annotations were considered core or expressed in all metatranscriptomes. C) Focusing on carbon, carbohydrate-active enzyme (CAZyme) family gene expression is shown across river metatranscriptomes (n = 57) as log-transformed expression (geTMM). In the box plot, upper and lower box edges extend from the first to third quartile and the line in the middle represents the median. The whiskers are 1.5 times the interquartile range and every point outside this range represents an outlier. D) The prevalence of each CAZyme family across the metatranscriptomes is shown by stacked bar plots, which represent the fraction of river metatranscriptomes with expression for each family, with bar colour corresponding to river size as denoted in the legend. The dotted line marks 50% of metatranscriptome samples. At right, the substrate type for each CAZyme family is given based on the DRAM metabolism summary; see Shaffer and Borton et al for substrate logic91. If more than one box is present, the CAZyme family can act upon multiple substrate types.

