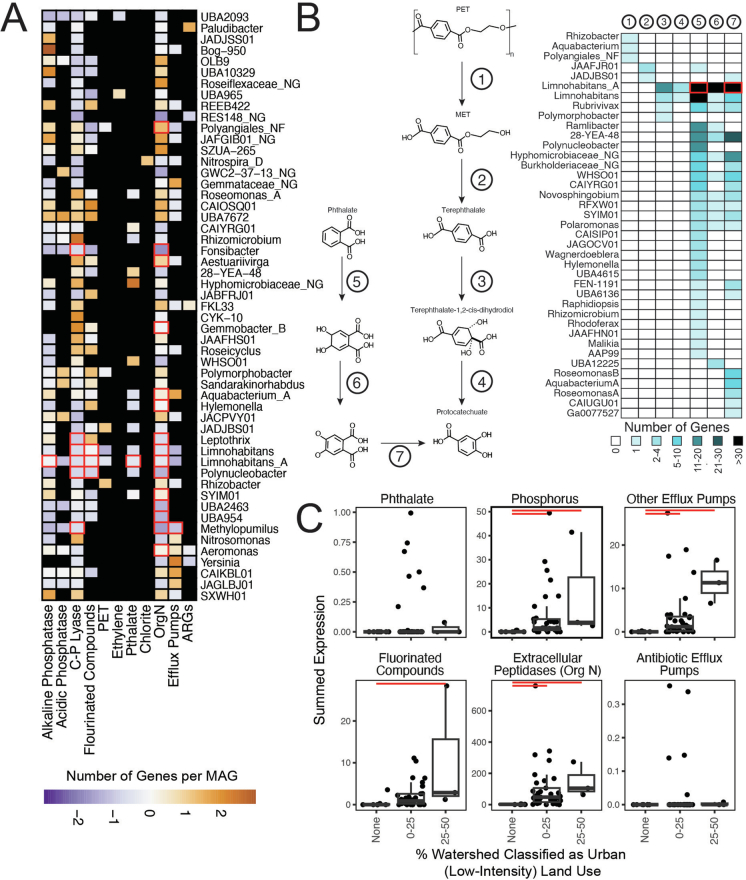
Extended Data Fig. 8. GROWdb inventory of Emerging Contaminant Genes.
A) Heatmap shows the genomic potential for emerging contaminant transformation categories by genus, with number of genes normalized to the number of genomes within a genus and scaled by column. Black boxes indicate no detection of a related gene, while red box outlines indicate expression of a gene within at least six metatranscriptomes. B) Several genera encoded the potential for Terephthalate and Phthalate microplastic related metabolisms, with the entire pathway from polyethylene terephthalate (PET) and Phthalate shown. Heatmap corresponds to the pathway with steps 1–7, where box colour indicates the number of genes encoded per genus. Red outlines indicate expression of a gene within at least six metatranscriptomes. C) Emerging contaminant gene expression categories were related to land use, with significant relationships detected among the percent of the watershed classified as low-intensity, urban impacted shown by horizontal red bars (p-value < 0.05). Each point represents a single metatranscriptome (n = 43). Boxplot upper and lower box edges extend from the first to third quartile and the line in the middle represents the median. The whiskers are 1.5 times the interquartile range and every point outside this range represents an outlier. A similar trend was shown with high-impact urban land use, but lacked power based on number of samples. Significance (p-value < 0.05) is noted by red bar.

