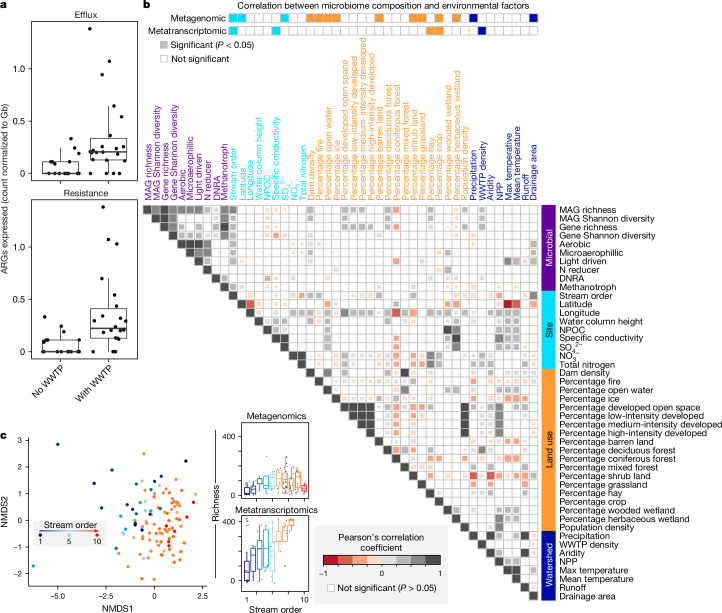
Fig. 3. Patterns and drivers of river microbiome composition and function.
a, The number of efflux pumps (top) and ARGs (bottom) expressed at sites without or with impact from WWTPs, normalized to Gb of metatranscriptomic sequencing per sample (n = 43 metatranscriptomes). b, Metagenomic and metatranscriptomic composition, function and diversity were related to 36 selected site, land-use or watershed variables using Mantel tests (top two rows). This was followed with pairwise comparisons using Pearson’s correlation (heat map in b), with only significant values shown, as determined using the two-sided cor.test in R. Variables are coloured by category, including microbial (purple), site or local (light blue), land-use (orange) and watershed metrics (dark blue). For pairwise comparisons of microbial data, metatranscriptomic metrics were used for diversity and function abundance calculations. c, Microbial community diversity was significantly associated with stream order as depicted by non-metric multidimensional scaling of genome resolved metagenomic Bray–Curtis distances (left, beta-diversity) and Pearson correlations of richness to stream order (right, alpha-diversity) with points (n = 105) coloured by stream order. For the box plots, the upper and lower box edges extend from the first to third quartile, the centre line represents the median and the whiskers are 1.5× the interquartile range; points outside this range represent outliers.

