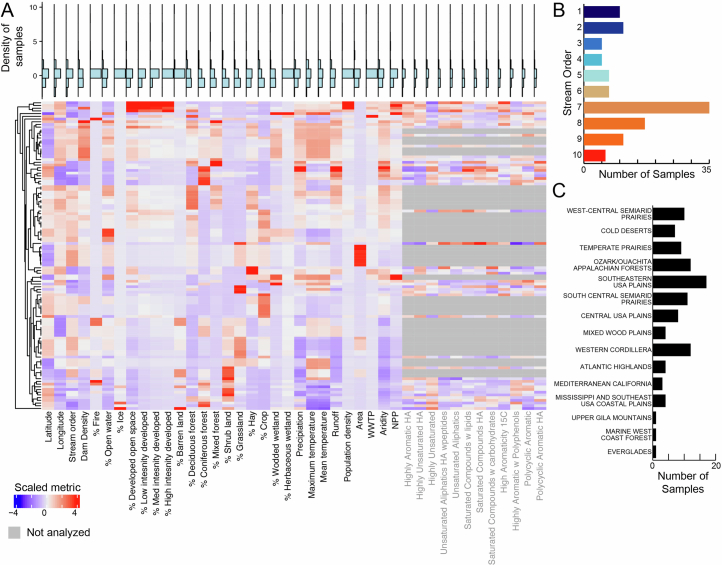
Extended Data Fig. 1. Distribution of river characteristics sampled in GROWdb.
A) Heatmap of geospatial and chemical parameters sampled in GROWdb, where columns are environmental and variables and rows are corresponding samples within GROWdb. Each variable has been scaled by subtracting the vector mean for each variable and dividing by its standard deviation. Variables in grey text were determined by FTICR. Blue histogram plots above highlight the distribution of samples for each variable, with high values at the top of the plot. Histogram plots of key variables used throughout the main text including stream order (B) and ecoregion (C) are also shown.

