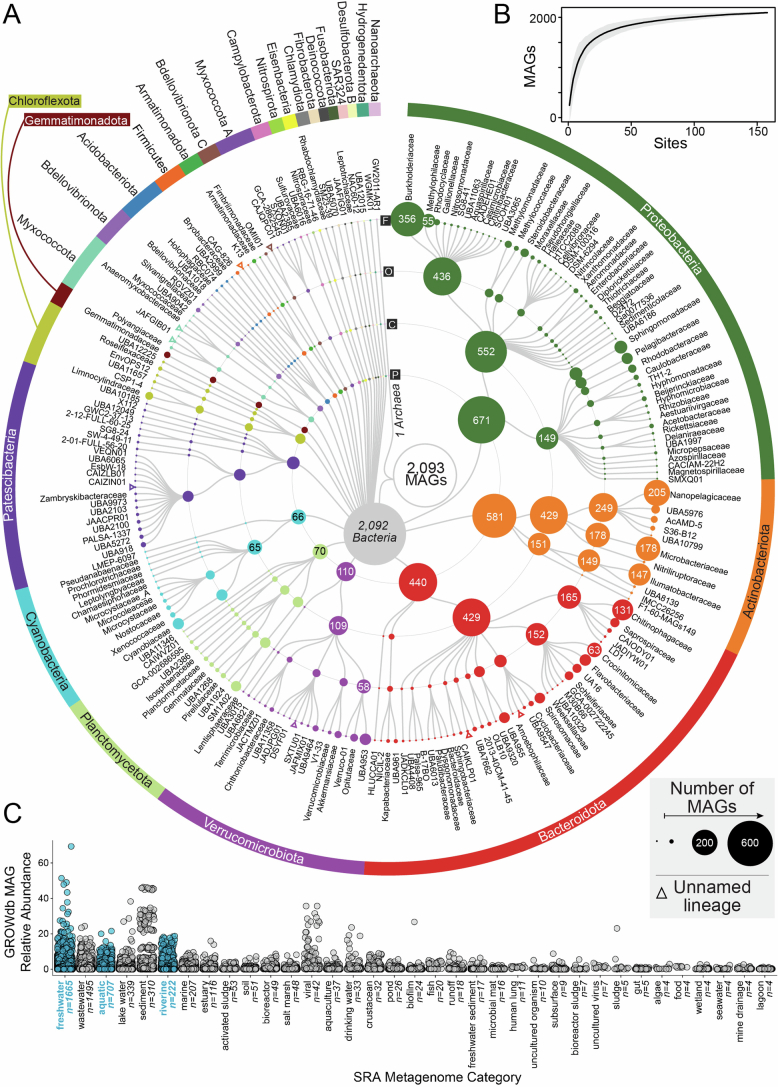
Extended Data Fig. 3. Taxonomic diversity of 2,093 unique surface water metagenome assembled genomes (MAGs) in GROWdb.
A) Cladogram shows GROWdb MAGs taxonomy with each sequential ring noting taxonomy level (Phylum, P; Class, C; Order, O; Family, F). Circle size indicates the number of genomes within a given taxonomy level and is further noted by MAG number inside the circle when sampling at that taxonomic position exceeds 50 MAGs sampled. Colours highlight phylum level taxonomy denoted on the outermost ring. Open triangles represent unnamed lineages within a particular level of taxonomy. B) MAG accumulation curve where the black line represents the mean richness of 100 random permutations and grey shading represents standard deviation. C) One dimensional boxplot displays the environments GROWdb MAGs were detected in across 266,764 metagenomes in the Sequence Read Archive with each point representing a single MAG. Upper and lower box edges extend from the first to third quartile and the line in the middle represents the median. The whiskers are 1.5 times the interquartile range and every point outside this range represents an outlier. Environments are ordered by number of metagenomes GROWdb MAGs were detected in from left to right, with the number of metagenomes also noted along the x-axis. Freshwater related environments are highlighted in blue.

