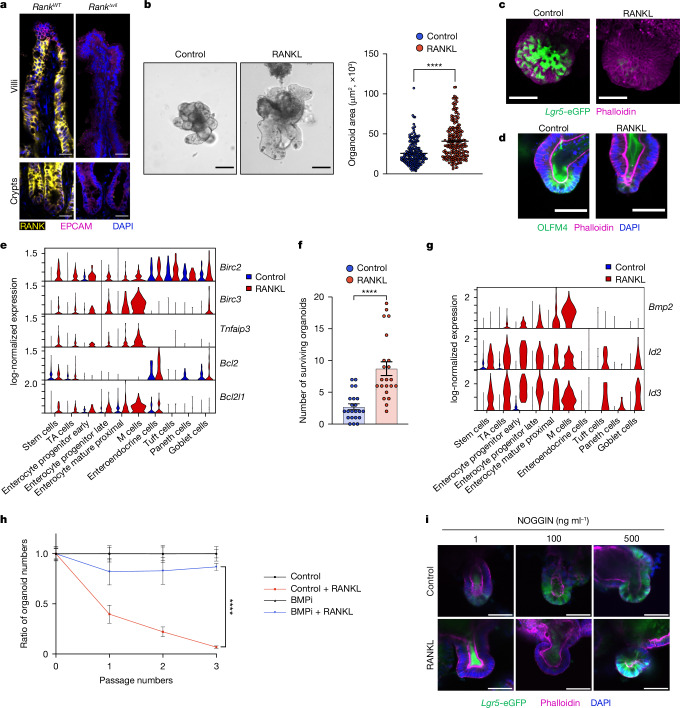
Fig. 1. RANK–RANKL drives growth and stem cell exhaustion in mouse intestinal organoids.
a, RANK and EPCAM intestinal staining in RankWT and RankΔvil mice. Scale bars, 25 μm. b, Left, representative images of jejunal organoids cultured without (control) and with recombinant mouse RANKL (rmRANKL; 50 ng ml−1) for 3 days. Scale bars, 100 μm. Right, quantification of organoid areas after culture with or without rmRANKL for 3 days. n = 185 (control) and n = 222 (rmRANKL) from three independent experiments. c, Representative 3D images of Lgr5-eGFP;Ires-creER/+ organoids. Scale bars, 50 μm. d, Representative images of OLFM4 staining of control and rmRANKL-treated organoids. Scale bars, 50 μm. e, Single-cell log-normalized expression of the indicated anti-apoptotic genes (y axis) in each cell type (x axis) (control jejunal organoids versus organoids cultured with 50 ng ml−1 rmRANKL for 12 h). f, Organoids treated with or without rmRANKL (50 ng ml−1) were irradiated and cultured in WENR medium with a ROCK inhibitor (Y-27632; 10 μM) (see Methods) for 7 days. The numbers of surviving organoids from three independent experiments are shown. n = 22 (control and rmRANKL). g, Single-cell log-normalized expression of Bmp2 and the BMP targeted genes Id2 and Id3 (y axis) in each cell type (x axis). h, The ratio of organoid numbers cultured in the presence of rmRANKL (50 ng ml−1), DMSO (control) or with the BMP inhibitor (BMPi) LDN193189 (0.5 μM). The ratio of organoid numbers in the control + RANKL group was normalized to the control group, whereas the ratio of organoid numbers in the iBMP + RANKL group was normalized to the iBMP group. Data are combined from two experiments. n = 10 for each group shown. i, Representative images of rmRANKL-treated Lgr5-eGFP;Ires-creER/+ organoids that were cultured with recombinant mouse NOGGIN. Scale bars, 50 μm. In the indicated images, phalloidin stains actin filaments and DAPI stains nuclei. Data are mean ± s.e.m. Statistical analysis was performed using two-tailed Student’s t-tests (b and f), two-sided Wilcoxon rank-sum tests between samples, adjusted using Benjamini–Hochberg correction (e and g) and one-way analysis of variance (ANOVA) with Tukey’s post hoc test (h); ****P < 0.0001. Further details on statistics and reproducibility are provided in the Methods.

