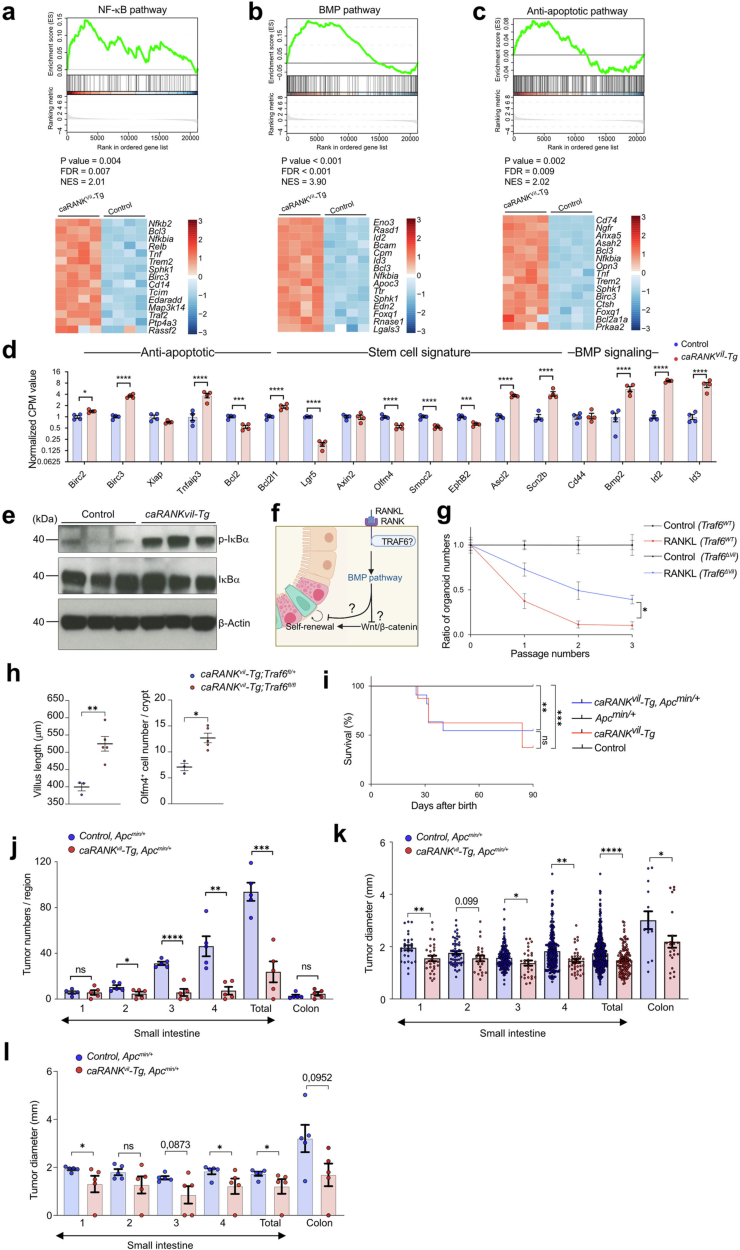
Extended Data Fig. 6. The key pathways for RANK-induced stem cell exhaustion in vivo.
a-c, Alterations in the NF-κB, anti-apoptotic, and BMP pathways in jejunal organoids from caRANKvil-Tg mice (n = 4) compared to organoids from control mice (n = 4). Upper panels show GSEA enrichment plots. Bottom panels show heatmaps of the top 15 genes upregulated in caRANKvil-Tg organoids. Expression profiles of RANKL stimulated jejunal organoids were compared to non-stimulated (control) jejunal organoids cultured for the same time period. Total RNA was isolated from small intestinal organoids generated from two weeks old control and caRANKvil-Tg littermate (n = 4 for each group) and processed for RNA-seq. d, Differential gene expression analysis of RNA-seq data from mouse jejunal organoids derived from caRANKvil-Tg (n = 4) and control (n = 4) mice. Normalized CPM values of selected transcripts of anti-apoptotic genes, stem cell signature genes and BMP signalling genes are shown. e, Western blotting of phosphorylated IκB-α and total IκB-α in isolated intestinal epithelial cells from 3 wks old control (n = 3) and caRANKvil-Tg (n = 3) mice. β-Actin is shown as a loading control. For gel resource data, see Supplementary Fig. 1. f, Schematic outline of the proposed role of RANK/RANKL-induced stem cell proliferation and exhaustion. The figure was created with BioRender.com. g, Ratios of the numbers of organoids derived from Traf6WT and Traf6ΔVil mice after prolonged culture in the presence of rmRANKL (50 ng/ml). Numbers of organoids were counted at each passage. The ratio of organoid numbers in the RANKL Traf6WT group was normalized to control Traf6WT organoids, whereas the ratio of organoid numbers in the RANKL treated Traf6ΔVil group was normalized to untreated control Traf6ΔVil organoids. Data were combined from two independent experiments. n = 11 (Traf6WT), n = 11 (Traf6WT + RANKL), n = 11 (Traf6ΔVil), n = 11 (Traf6ΔVil + RANKL). h, Average length of villi and average number of OLFM4+ cells in each crypt per mouse from the indicated mice in the indicated mice described in Fig. 2d,e. i, Kaplan–Meier survival curve of control (n = 14), caRANKvil-Tg (n = 8), Apcmin/+ (n = 13), and caRANKvil-Tg, Apcmin/+ (n = 11) mice. j, Numbers of macroscopic adenomas and k,l, tumour diameters in the small intestine and colon of 4 months old control Apcmin/+ (n = 5 mice) and caRANKvil-Tg, Apcmin/+ (n = 5) mice. Small intestines were divided equally into 4 parts from the proximal (duodenum, labelled 1) to the distal (ileum, labelled 4) and adenomas assessed for each region. Total tumour numbers in Apcmin/+ mice; n = 29 in region 1, n = 53 in region 2, n = 156 in region 3, n = 231 in region 4, n = 469 in total, n = 14 in colon, and in caRANKvil-Tg, Apcmin/+ mice (n = 29/24/29/37/119/23). Each data point in k represents the measurements of the tumour diameter in individual tumours and in l represents the average measurement of the tumour diameters per mouse. Data are mean ± s.e.m. *P < 0.05; **P < 0.01; ***P < 0.001; ****P < 0.0001; ns, not significant. Enrichment-adjusted p-values (p-value), False Discovery Rates (FDR) and Normalized Enrichment Scores (NES) were calculated using two sided-fGSEA (a-c). Two-sided DESeq2 Wald tests, adjusted with the Benjamini–Hochberg procedure (d). One-way analysis of variance (ANOVA) with Tukey’s post hoc test (g); Two-tailed Mann–Whitney U-test (h,j,l); Kaplan–Meier survival curve with a log-rank test (i); Two-tailed Student’s t-test (k).

