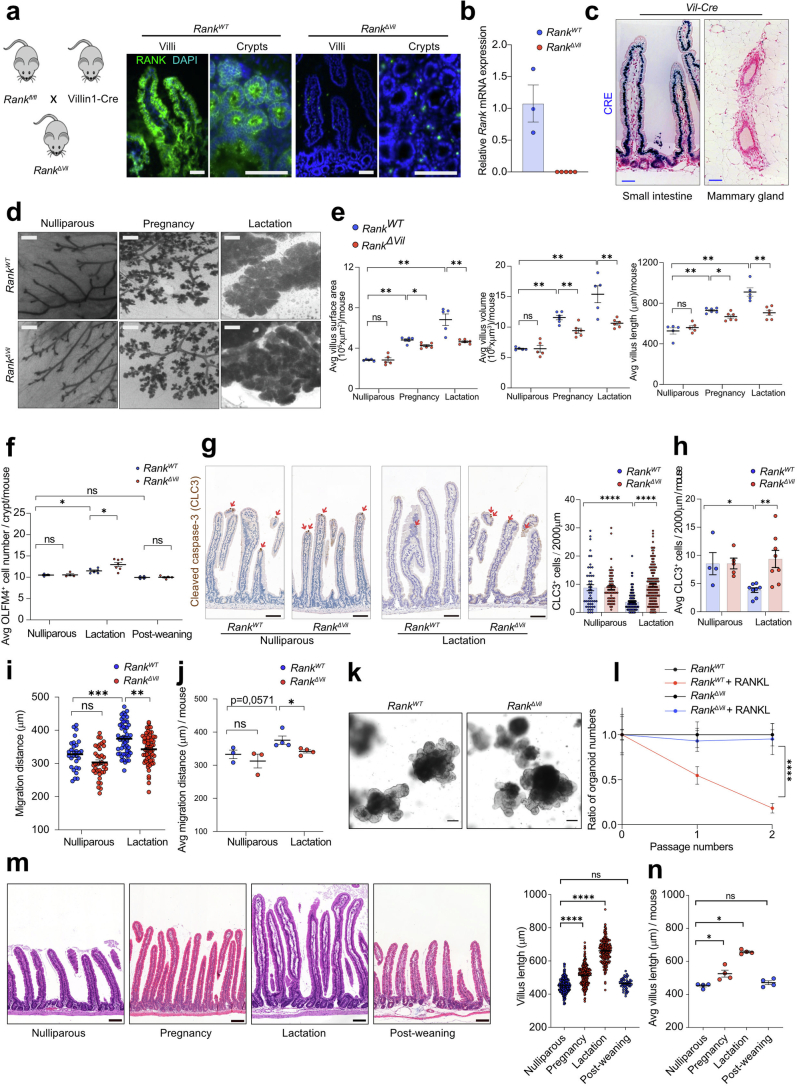
Extended Data Fig. 7. Cellular characterization of intestinal villi expansion in pregnancy and lactation.
a, Mating strategy to generate intestinal epithelial cell specific Rank deleted mice (left) and anti-RANK immunostaining on intestinal cryo-sections from nulliparous control RankWT and RankΔVil mice (right). Scale bars, 50 μm. b, Quantitative RT–PCR analysis of Rank mRNA expression in isolated small intestinal epithelial cells from nulliparous control RankWT (n = 3) and RankΔVil (n = 5) littermates. c, Representative immunostaining to detect CRE expression (blue) in the small intestine (left panel) and mammary gland (right panel) of Villin1-Cre mice. Paraffin sections were counterstained with hematoxylin. Scale bars, 50 μm. d, Representative whole mount images (hematoxylin staining) of mammary glands from nulliparous RankWT, nulliparous RankΔVil, pregnant RankWT (day 18.5 of pregnancy, P18.5), pregnant RankΔVil females, lactating RankWT (5 days after delivery, L5) and lactating L5 RankΔVil females. Scale bars, 500 μm. e, Small intestinal villi length, volume and surface areas in indicated mice. Each data point represents average villi length, volume and surface area per mouse in the indicated mice described in Fig. 3a. f, Quantification of the average number of OLFM4+ cells in each crypt per mouse in the indicated mice described in Fig. 3b. g,h, Cell death of villous epithelial cells from nulliparous RankWT and RankΔVil females and age-matched lactating (L5) RankWT and RankΔVil dams, as determined by immunostaining of cleaved caspase 3 (CLC3). Representative immunostaining. Scale bars, 100 μm (left in g). Quantification of CLC3 positive cells in villi per 2 mm of the intestine in nulliparous RankWT (n = 4 mice, n = 49 regions analysed) and RankΔVil females (n = 5/59) and age-matched lactating (L5) RankWT (n = 8/162) and RankΔVil dams (n = 8/135) (right in g and h). Each data point represents the numbers of CLC3 positive cells in villi per each 2 mm of the intestine (g) and average number per mouse (h). i,j, Quantification of the EdU-labelled intestinal epithelial cell migration along the crypt-villus axis in nulliparous RankWT (n = 3 mice, n = 29 crypt-villus axis analysed) and RankΔVil females (n = 3/37) and age-matched lactating (L5) RankWT (n = 4/52) and RankΔVil dams (n = 4/62). Tissues were harvested 24 h after EdU administration. Each data point represents the measurements of the migration distance in individual crypt-villus axis (i) and the average distance per mouse (j). k, Representative images of jejunal organoids generated from RankWT and RankΔVil mice. Scale bars, 100 μm. l, Ratios of the number of jejunal organoids derived from RankWT and RankΔVil mice after prolonged culture in the presence of rmRANKL (50 ng/ml). The number of organoids was counted at each passage. The ratio of organoid numbers in the RankWT + RANKL group was normalized to control RankWT organoids, whereas the ratio of organoid numbers in the RankΔVil + RANKL group was normalized to untreated RankΔVil organoids. Data are from two independent experiments. n = 6 (RankWT), n = 6 (RankWT + RANKL), n = 6 (RankΔVil), n = 6 (RankΔVil + RANKL). m,n, Representative hematoxylin and eosin (H&E) stained images of the upper small intestine (left in m) and quantification of upper small intestinal villus lengths (right in m, n) in age matched wild type nulliparous females (n = 4 mice, n = 310 villi analysed), pregnant females (P18.5) (n = 4/272), lactating dams (L5, 5 days after delivery) (n = 4/212) and females 6 weeks after weaning of the offspring (n = 4/49). Scale bars, 100 μm. Each data point represents the length of individual villi (m) and average length per mouse (n). Data are mean ± s.e.m. *P < 0.05; **P < 0.01; ***P < 0.001; ****P < 0.0001; ns, not significant. Two-tailed Mann–Whitney U-test (e,f,h,j,n); One-way analysis of variance (ANOVA) with Tukey’s post hoc test (g,i,l,m).

