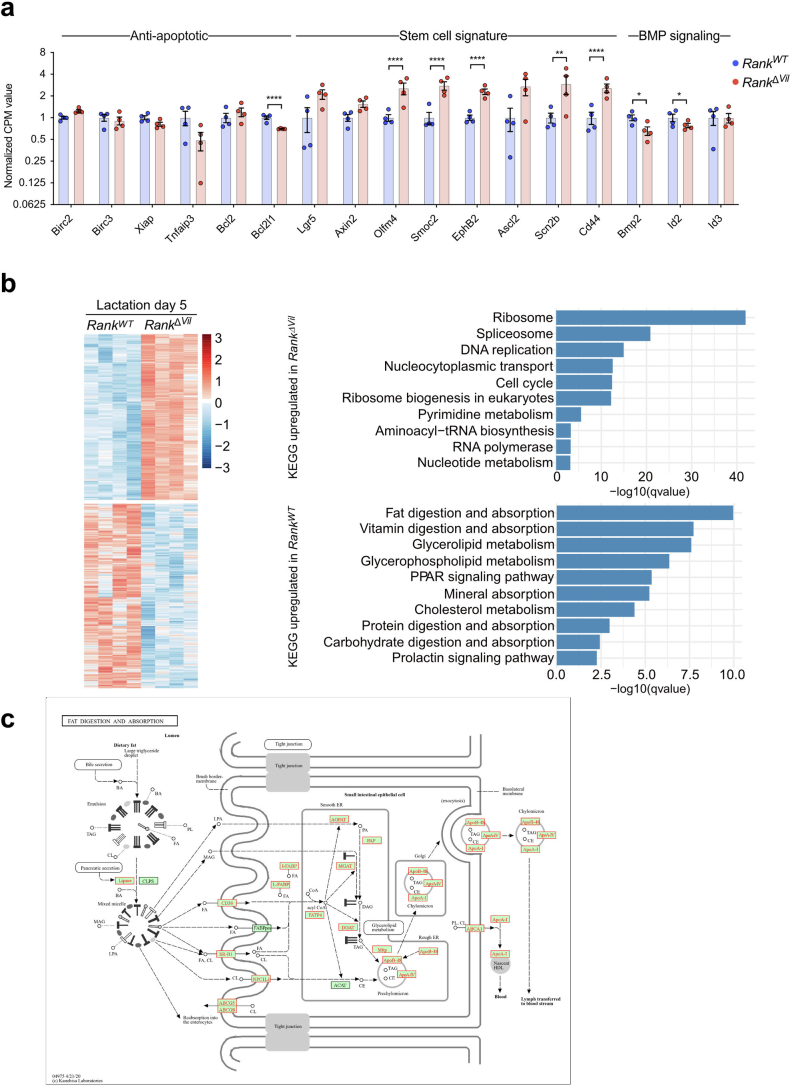
Extended Data Fig. 9. Bulk RNA-seq profiling of the intestine from lactating mice.
a, Differential gene expression analysis of bulk RNA-seq data from intestinal epithelial cells isolated from L5 RankWT and L5 RankΔVil mice (n = 4 for each group). Normalized CPM values of selected anti-apoptotic, stem cell signature and BMP signalling genes are shown. b, Heat maps of differentially expressed genes (left) and KEGG pathway analysis of differentially expressed genes (right) comparing intestinal epithelial cells from L5 RankWT and L5 RankΔVil dams. The colour scale shows relative expression profiles. KEGG pathways overrepresented among up- and down-regulated differentially expressed genes (padj 0.05) are shown. c, KEGG pathway analysis for fat digestion and lipid absorption (mmu04975). The significantly upregulated genes in L5 lactating RankWT versus L5 RankΔVil dams are highlighted in red. Genes that were not differentialy expressed between the groups are highlighted in green. Permission to use this figure was obtained from KEGG. Data are mean ± s.e.m. *P < 0.05; **P < 0.01; ****P < 0.0001; ns, not significant. Two-sided DESeq2 Wald tests, adjusted with the Benjamini–Hochberg procedure (a).

