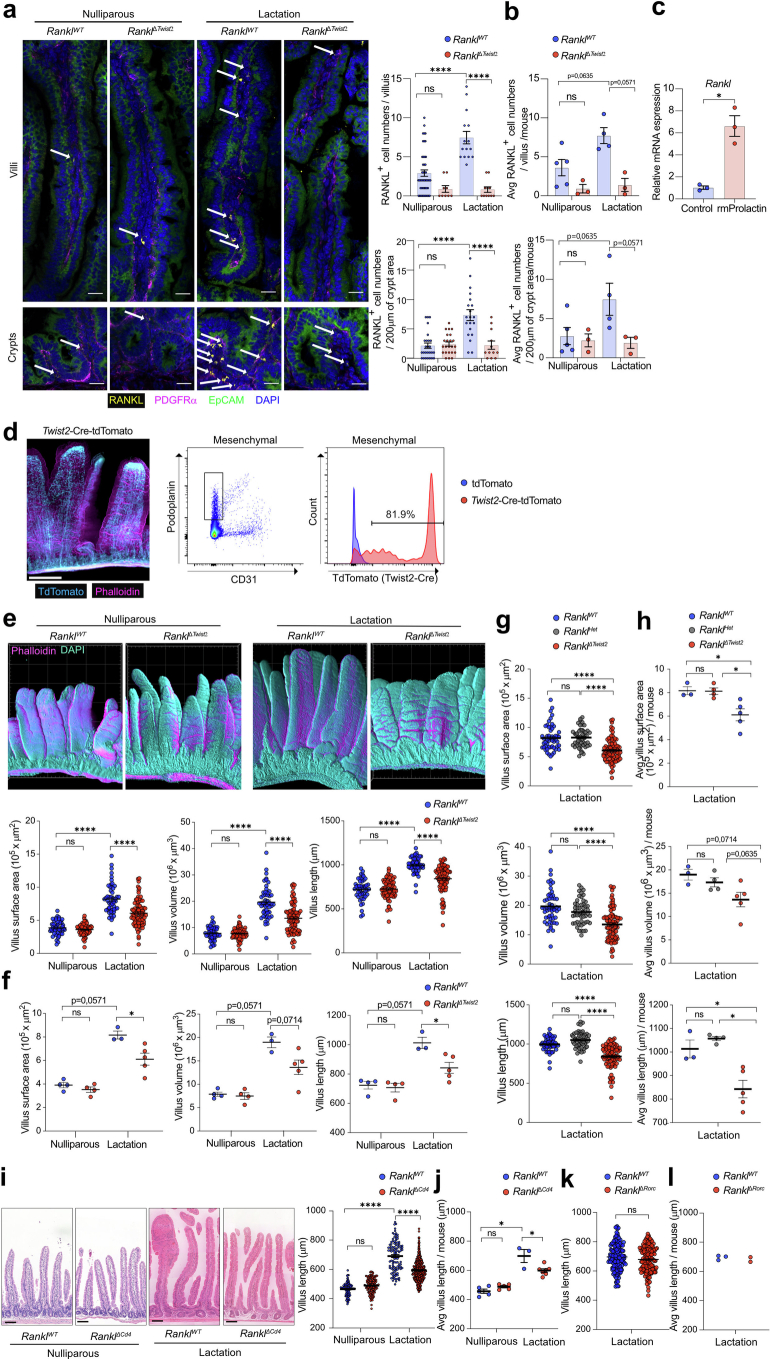
Extended Data Fig. 10. Parenchymal RANKL drives intestinal villous expansion.
a,b, Representative immunostaining to detect RANKL expressing cells (arrows) in small intestinal cross-sections (Left in a). Sections were also stained for EpCAM to detect intestinal epithelial cells and PDGFRα to visualize subepithelial cells in villi. Scale bars, 25 μm. Quantification of RANKL positive cells per villus and 200 μm of crypt area from nulliparous RanklWT (n = 5 mice, n = 47 villi, n = 26 regions analysed) and RanklΔTwist2 (n = 3/9/23) mice and lactating (L5) RanklWT (n = 4/15/20) and RanklΔTwist2 (n = 3/11/12) mice (right in a, b). Each data point represents the measurements of numbers of RANKL+ cells per villi or 2 mm of crypt area (a) and the average number per mouse (b). c, Quantitative RT–PCR analyses to compare expression levels of Rankl in mesenchymal cultures derived from lamina propria. Data represent the relative expression of Rankl in recombinant mouse Prolactin (rmProlactin)-stimulated mesenchymal cells to control (no rmProlactin) mesenchymal cells (set at 1). rmProlactin stimulation was for 48 h. n = 3 (control), n = 3 (rmProlactin). d, Left panels, 3D reconstruction of small intestinal tissue from Twist2-Cre-tdTomato mice using confocal microscopy. Scale bars, 300 μm. Right panels, gating strategy to determine tdTomato-expression in mesenchymal cells from Twist2-Cre-tdTomato mice using FACS. e,f, Representative 3D reconstructions of small intestine from age-matched nulliparous RanklWT and RanklΔTwist2 and lactating (L5) RanklWT and RanklΔTwist2 dams. Grid spacing is 200 μm (upper in e). Villous length, volume and surface areas in nulliparous RanklWT (n = 4 mice, n = 49 villi analysed); nulliparous RanklΔTwist2 (n = 4/63); L5 RanklWT (n = 3/53); RanklΔTwist2 (n = 5/82) mice(lower in e, f). Each data point represents the measurements of length, volume and surface area of individual villi (e) and the average value per mouse. g,h, Lengths, volumes and surface areas of villi were measured in age matched L5 RanklWT (n = 3 mice, n = 53 villi analysed), L5 RanklΔTwist2-Het (n = 4/50) and L5 RanklΔTwist2 (n = 5/82) littermates, using confocal microscopy and 3D tissue reconstructions. Each data point represents the measurements of length, volume and surface area of individual villi (g) and the average value per mouse(h). i,j, Small intestinal images from age-matched nulliparous and lactating (L5) RanklWT and RanklΔCd4 littermates. Left: Representative H&E stained intestinal sections. Scale bars, 100 μm (left in i). Quantification of villus length in nulliparous RanklWT (n = 5 mice, n = 89 villi analysed) and RanklΔCd4 (n = 5/135) mice and L5 RanklWT (n = 3/106) and RanklΔCd4 (n = 7/403) mice (right in i, j). Each data point represents the measurements of length of individual villi (i) and the average value per mouse(j). k,l, Quantification of villus length in age-matched L5 RanklWT (n = 3 mice, n = 149 villi analysed) and RanklΔRorc (n = 2/148) mice, quantified from H&E cross sections. Each data point represents the measurements of length, volume and surface area of individual villi (k) and the average value per mouse(l). Data are mean ± s.e.m. *P < 0.05; ns, not significant. One-way analysis of variance (ANOVA) with Tukey’s post hoc test (a,e,g,i); Two-tailed Paired t-test (c); Two-tailed Mann–Whitney U-test (b,f,h,j); Two-tailed Student’s t-test (k).

