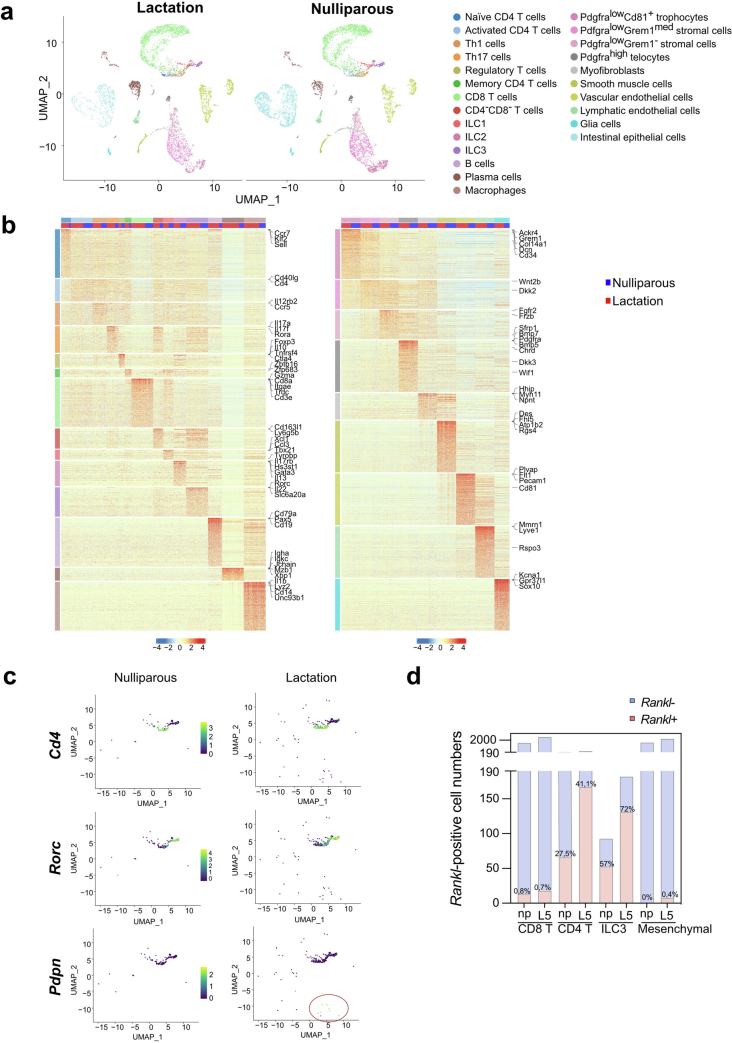
Extended Data Fig. 11. Single-cell RNA-seq profiling of lamina propria cells in nulliparous and lactating mice.
a, Uniform manifold approximation and projection (UMAP) of 16,218 cells from nulliparous mice (6,822 cells) and lactating wild type mice (9,396 cells). Cells are colour-coded according to their cell-type annotation using unsupervised clustering. b, Heatmap representing scaled single-cell log-normalized expression of the top 300 differentially expressed genes for immune (left panel) and mesenchymal cell-types (right panel). Column annotation corresponds to cell-types (shown in the colour code as in panel a) and study conditions (nulliparous vs lactation L5). 200 cells per cell-type are represented after random downsampling. Genes of interest for each cell-type are indicated c, UMAP of Rankl-positive cells from age-matched nulliparous and L5 lactating littermate. Cell types are colour-coded as in a. d, Numbers of Rankl-positive and ratios of Rankl-positive CD4 T cells, CD8 T cells, ILC3 cells, and mesenchymal cells per total cell numbers from age-matched nulliparous and L5 lactating mice.

