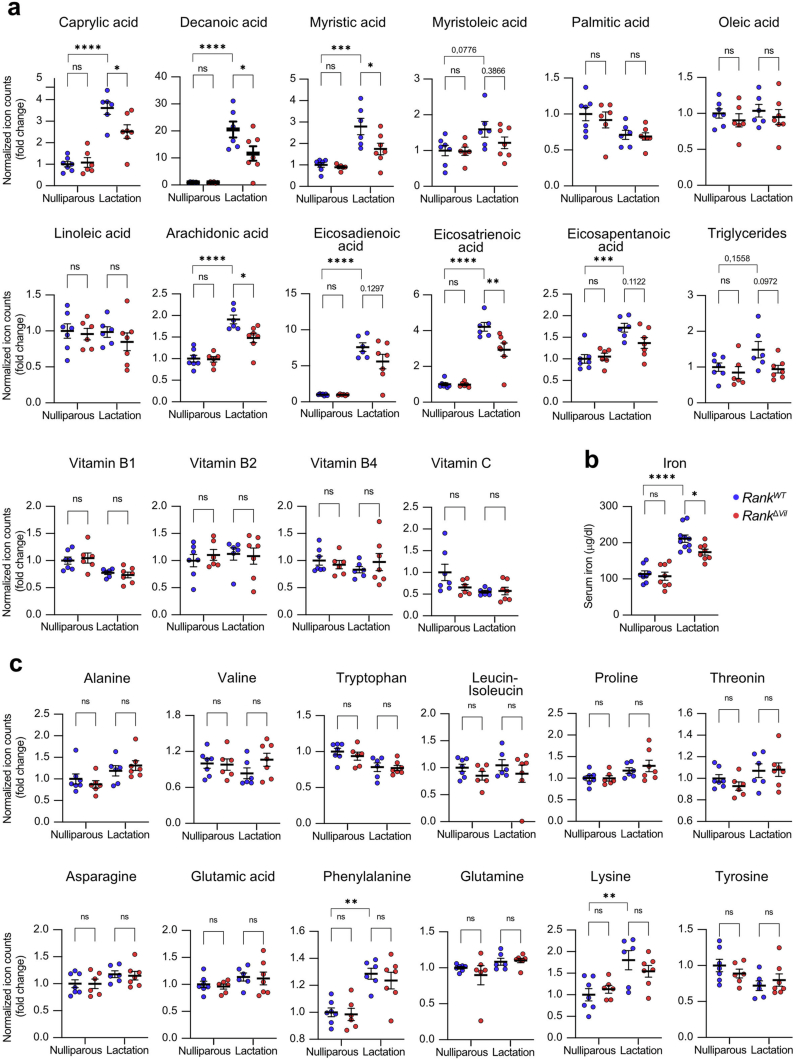
Extended Data Fig. 12. Metabolomic profiling of serum from nulliparous and lactating mice.
a,c, Levels of the indicated free fatty acids, triglycerides, and Vitamins (a) and free amino acids (c) in the serum from nulliparous RankWT (n = 7) and RankΔVil (n = 6) females and lactating (L8) RankWT (n = 6) and RankΔVil (n = 7) dams, measured by mass spectrometry. b, Levels of the indicated iron in the serum from nulliparous RankWT (n = 8) and RankΔVil (n = 8) females and lactating (L8) RankWT (n = 10) and RankΔVil (n = 8) dams, measured by a photometric colour test. Dots represent relative levels of individual data points normalized to nulliparous control females. Data are shown as mean ± s.e.m. *P < 0.05; **P < 0.01; ns, not significant. One-way analysis of variance (ANOVA) with Tukey’s post hoc test (a,b,c).

