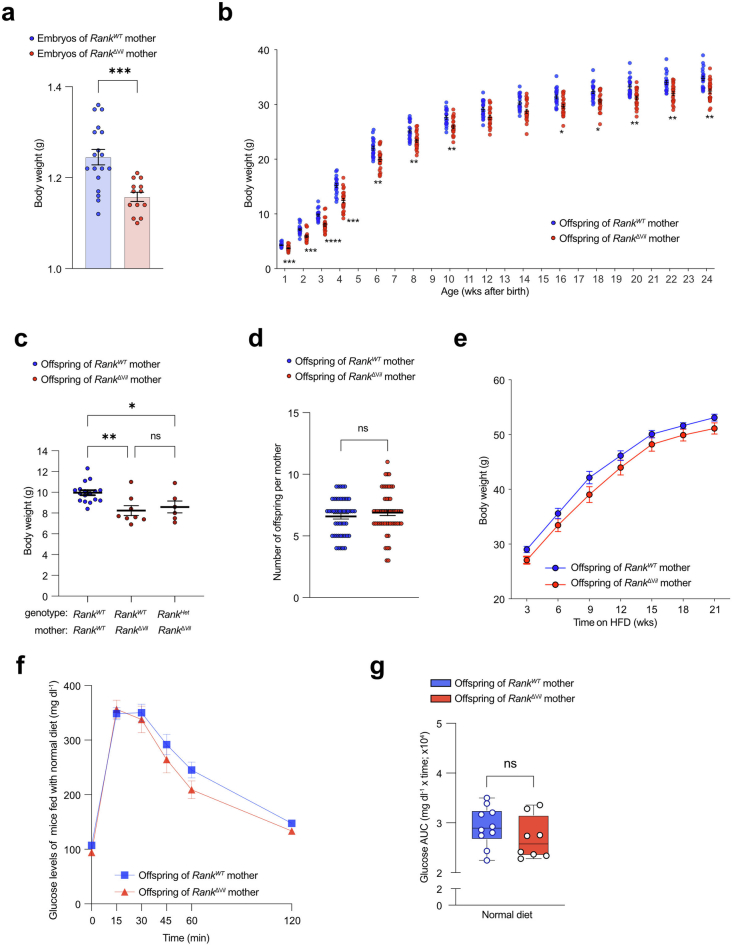
Extended Data Fig. 14. Transgenerational effects in the offspring of RankΔvil mothers.
a, Body weights of E18.5 male embryos of RankWT (n = 18) and RankΔVil (n = 13) females fed normal chow. b, Body weights of male offspring born to RankWT (n = 20) and RankΔVil (n = 23) dams fed normal chow. Mice were monitored from wk 1 to wk 24th after birth. Each data point represents one offspring mouse. c, Body weights of 3 wks old RankWT and RankHET offspring born to RankWT and RankΔVil dams. All pregnancies were syngeneic crosses with C57BL/6J males, thus the offspring of RankΔVil dams were either RankWT (Rankflox/WTVilcre−) (n = 8) or RankHet (Rankflox/WTVilcre+) (n = 6); both of these groups exhibit reduced body weights as compared to RankWT(Rankflox/WTVilcre−) offspring (n = 17) born to RankWT dams. Dots represent individual mice. d, Numbers of offspring from RankWT (n = 48) and RankΔVil (n = 54) dams. e, Body weights of male offspring born to RankWT (n = 18) and RankΔVil (n = 16) dams fed high fat diet (HFD). f,g, Oral glucose-tolerance test (f) and corresponding area under the curve (AUC) (g) in male (n = 10/8) offspring of RankWT and RankΔVil dams, fed normal chow for 25 wks. Box-and-whisker plots in g show the median (middle lines), interquartile range (boxes), and minimum to maximum values (whiskers) throughout. Data are mean ± s.e.m. *P < 0.05; **P < 0.01; ***P < 0.001; ****P < 0.0001; ns, not significant. Two-tailed Student’s t-test (a,d,g); Two-way ANOVA with Sidak’s multiple comparison (b); One-way analysis of variance (ANOVA) with Tukey’s post hoc test (c).

