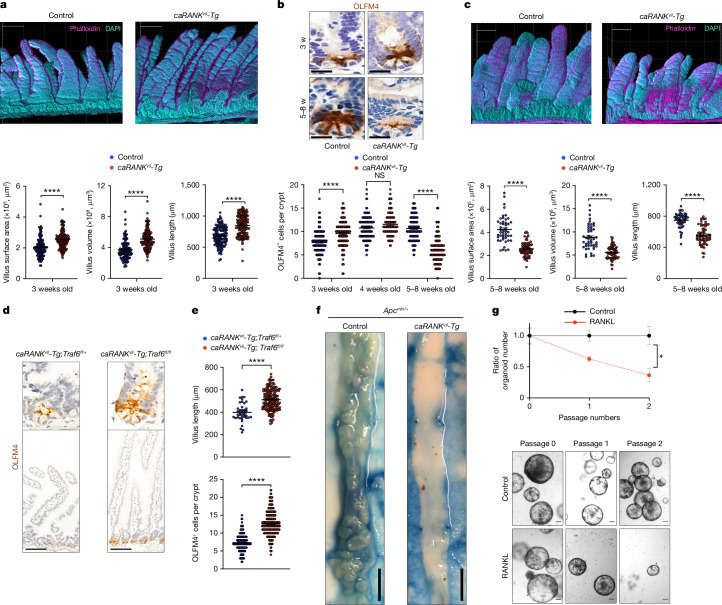
Fig. 2. Constitutive activation of RANK in vivo modulates the intestinal stem cell niche.
a, Representative 3D reconstruction of small intestine from 3-week-old control and caRANKvil-Tg mice (top). Grid spacing is 200 μm. Bottom, villus length, volume and surface areas of control (n = 6 mice, n = 126 villi) and caRANKvil-Tg mice (n = 7 mice, n = 145 villi analysed). b, Representative OLFM4 immunostaining in the small intestines of 3- and 5–8-week-old control and caRANKvil-Tg mice (top). Scale bars, 20 μm. Bottom, the numbers of OLFM4+ cells per crypt in control and caRANKvil-Tg mice were quantified at 3 weeks (n = 3 mice, n = 234 crypts (control); n = 3 mice, n = 205 crypts (caRANKvil-Tg)), 4 weeks (n = 6 mice, n = 162 crypts (control); n = 4 mice and n = 110 crypts (caRANKvil-Tg)) and at 5–8 weeks (n = 4 mice, n = 203 crypts (control); n = 4 mice, n = 178 crypts (caRANKvil-Tg)) of age. c, Representative 3D reconstruction of the small intestines of 5–8-week-old control and caRANKvil-Tg mice (top). Grid spacing is 200 μm. Bottom, the villus length, volume and surface areas of control (n = 4 mice, n = 47 villi) and caRANKvil-Tg mice (n = 5 mice, n = 65 villi). d, Representative OLFM4 immunostaining in the small intestines of 8-week-old caRANKvil-Tg;Traf6fl/+ (n = 3) and caRANKvil-Tg;Traf6fl/fl (n = 5) mice. Scale bars, 100 μm. e, The numbers of OLFM4+ cells per crypt and the villus length in caRANKvil-Tg;Traf6fl/+ (n = 3 mice, 172 crypts, 40 villi) and caRANKvil-Tg; Traf6fl/fl (n = 5 mice, 299 crypts, 167 villi) mice. f, Representative macroscopic images of the small intestines of Apcmin/+ and caRANKvil-Tg;Apcmin/+ mice. Scale bars, 7.5 mm. g, The ratio of tumoroid numbers cultured without (control) or with rmRANKL (50 ng ml−1) (top). The ratio of organoid numbers in the RANKL-treated group was normalized to the control group. Data were combined from two independent experiments. n = 4 (control) and n = 4 (rmRANKL). Bottom, representative images of tumoroids established from Apcmin/+ mice at passage 0, 1 and 2, cultured in the absence (control) or presence of rmRANKL (50 ng ml−1). Scale bars, 100 μm. Each point represents the measurement of length, volume and surface area (a (bottom), c (bottom) and e (top)), and the number of OLFM4+ cells per crypt (b (bottom) and e (bottom)). Data are mean ± s.e.m. *P < 0.05; NS, not significant. Statistical analysis was performed using two-tailed Student’s t-tests (a, c, e and g) and one-way ANOVA with Tukey’s post hoc test (b). Further details on statistics and reproducibility are provided in the Methods.

