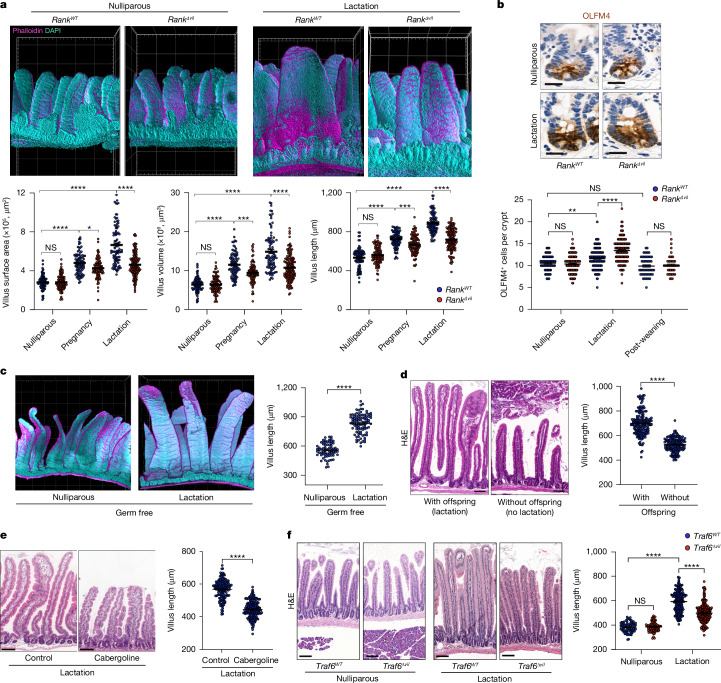
Fig. 3. RANK–RANKL controls intestinal villus expansion in pregnancy and lactation.
a, Representative 3D reconstruction of the upper small intestine from nulliparous and lactating (5 days after delivery, L5) RankWT and RankΔvil female mice (top). Grid spacing is 200 μm. Bottom, the small intestinal villus length, volume and surface areas in nulliparous RankWT (n = 5 mice, n = 88 villi), nulliparous RankΔvil (n = 5 mice, n = 97 villi), P18.5 RankWT (n = 6 mice, n = 89 villi), P18.5 RankΔvil (n = 6 mice, n = 93 villi), L5 RankWT (n = 5 mice, n = 91 villi) and L5 RankΔvil (n = 6 mice, n = 141 villi) mice. b, Representative OLFM4 immunostaining in the small intestines of the indicated mice (top). Scale bars, 20 μm. Bottom, quantification of OLFM4+ cells per crypt in nulliparous RankWT (n = 3 mice, n = 87 crypts), nulliparous RankΔvil (n = 4 mice, n = 130 crypts), L5 RankWT (n = 6 mice, n = 160 crypts) and L5 RankΔvil (n = 7 mice, n = 181 crypts) mice, and RankWT (n = 4 mice, n = 59 crypts) and RankΔvil (n = 5 mice, n = 44 crypts) mice 6 weeks after weaning of the offspring. c, Representative 3D images (left) and villi lengths of small intestines from age-matched nulliparous (n = 3 mice, n = 70 villi analysed) and lactating (n = 5 mice, n = 94 villi) germ-free C57BL6 mice (right). Grid spacing is 200 μm. d, Left, representative small intestinal sections (haematoxylin and eosin (H&E) staining) of L5 wild-type mice and wild-type mice whose offspring were removed on 1 day after delivery (no lactation). Scale bars, 100 μm. Right, quantification of villus length in L5 dams (with offspring) (n = 7 mice, n = 170 villi) and female mice with their offspring removed (without offspring) (n = 5 mice, n = 158 villi). e, Representative small intestinal sections (H&E staining) (left) and quantification of villi lengths (right) of L5 wild-type mice treated with DMSO or cabergoline (5 mg per kg) for 5 consecutive days starting on the day of delivery. Villi were assessed on day 5 after delivery. Scale bars, 100 μm. Right, quantification of villus length in mice treated with DMSO (n = 4 mice, n = 148 villi) and mice treated with cabergoline (n = 4 mice, n = 179 villi). f, Representative H&E-stained intestinal sections from nulliparous Traf6WT and Traf6Δvil mice, and L5 lactating Traf6WT and Traf6Δvil mice (left). Scale bars, 100 μm. Right, quantification of villous length in nulliparous Traf6WT (n = 4 mice, n = 76 villi) and Traf6Δvil (n = 5 mice, n = 73 villi) mice, and L5 Traf6WT (n = 6 mice, n = 198 villi) and Traf6Δvil (n = 5 mice, n = 226 villi) mice. Data are mean ± s.e.m. Each point represents the measurement of length, volume and surface area (a (bottom) and c–f (right)), and the number of OLFM4+ cells per crypt (b, bottom). Statistical analysis was performed using one-way ANOVA with Tukey’s post hoc test (a, b and f) and two-tailed Student’s t-tests (c–e); **P < 0.01, ***P < 0.001.

