
FIGURE 5.
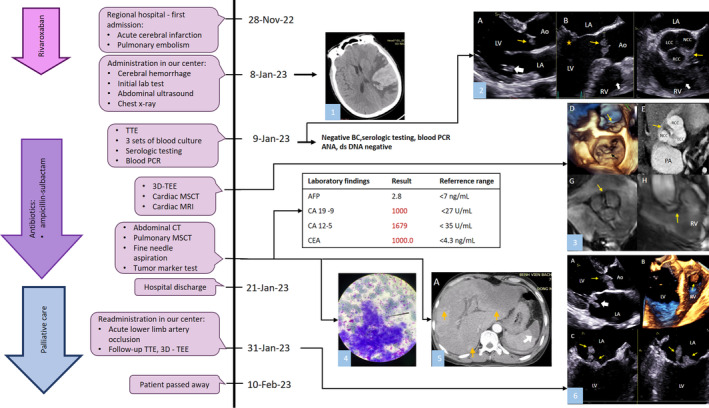
Timeline of patient clinical course. (1) Cerebral infarction with hemorrhagic transformation observed on non‐contrast CT. (2) A—TTE parasternal long‐axis view showed masses on both aortic valve cusps (yellow arrow) and a mitral valve mass on the posterior leaflet (white arrow). B—TEE X‐plane imaging from the mid‐esophageal position; left: AV long‐axis view showed aortic valve masses (yellow arrow), a mitral valve mass on the posterior leaflet (star), and a right ventricular mass (white arrow); right: AV short‐axis view showed cardiac masses on all cusps of the aortic valve (yellow arrow) and the right ventricular mass (white arrow). (3) D—3D TEE en face view showed the mitral valve mass (black arrow) and aortic valve masses (yellow arrow). E—Cardiac MSCT revealed aortic masses (yellow arrow) on all three cusps of the aortic valve. F—TTE apical five‐chamber view showed the right ventricular mass (yellow arrow) and the aortic valve masses (white arrow). G—CMR cine imaging showed the aortic masses (arrow). H—CMR showed the right ventricular mass (arrow). (4) Fine needle aspiration. (5) A—Hypointense masses identified in the left and right liver lobes (yellow arrows) and in the spleen (white arrow) during the arterial phase of abdominal MSCT. (6) A—TTE parasternal long‐axis view showed aortic valve masses on both cusps (yellow arrow) and the mitral valve mass on both leaflets (white arrow). B—3D TOE showed the right ventricular mass (yellow arrow). C—TEE X‐plane imaging from the mid‐esophageal position; left: long‐axis view showed mitral valve masses on both leaflets (yellow arrows); right: mitral commissural view also showed mitral valve masses on both leaflets (yellow arrows).