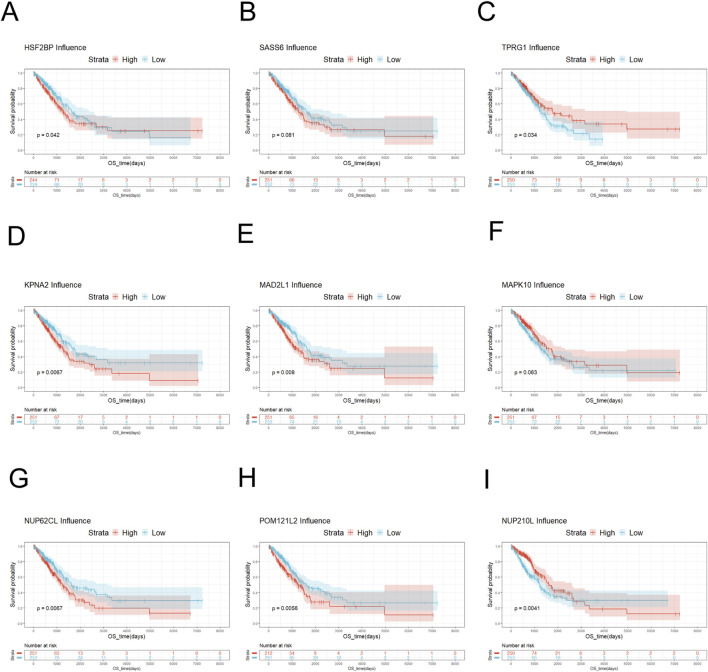
FIGURE 3.
Survival analysis of key genes. (A) Survival analysis of HSF2BP showed no significant difference in survival probability between low-risk HSF2BP and high-risk HSF2BP. (B) Survival analysis of SASS6 exhibited that the survival probability of low-risk SASS6 was slightly higher than that of high-risk SASS6. (C) Survival analysis of TPRG1 displayed that the survival probability of high-risk TPRG1 was higher than that of low-risk TPRG1. (D) Survival analysis of KPNA2 manifested that low-risk KPNA2 had a higher survival probability than high-risk KPNA2. (E) Survival analysis of MAD2L1 demonstrated that low-risk MAD2L1 had a higher survival probability than high-risk MAD2L1. (F) Survival analysis of MAPK10 showed that the survival probability of high-risk MAPK10 was higher than that of low-risk MAPK10. (G) Survival analysis was performed on NUP62CL, and the result indicated that the survival probability of low-risk NUP62CL was higher than that of high-risk NUP62CL. (H) Survival analysis was performed on POM121L2, and the probability of survival was higher for low-risk POM121L2 than for high-risk POM121L2. (I) Survival analysis was performed on NUP210L. When the overall survival time was less than 3,700 days, the survival probability of high-risk NUP210L was higher than that of low-risk NUP210L. When the overall survival was greater than 3,700 days, the probability of survival was higher for low-risk NUP210L than for high-risk NUP210L.

