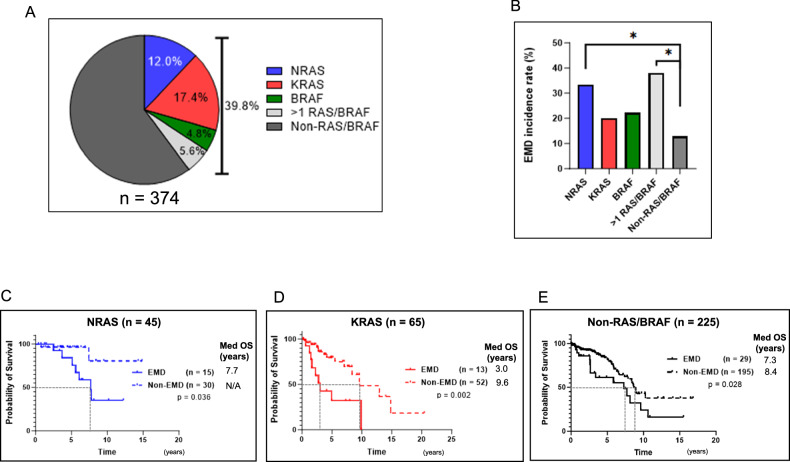
Fig. 2. Impact of BM-RAS/BRAF mutations on the development of EMD and overall survival (OS).
A Bone marrow mutational status of 374 in patients who met the criteria for plasma cell cut-off of 9%: single-NRAS (12.0%), single-KRAS (17.4%), single-BRAF (4.8%), and >1 mutation (5.6%)). B EMD incidence rate by BM mutational status (n = 374: single-NRAS (33.3%), single-KRAS (20.0%), single-BRAF (22.2%), >1 mutation (38.1%) and non-RAS/BRAF (12.9%)) (p < 0.05). C OS of 45 BM-NRAS patients with EMD (Median OS: 7.7 years vs Not reached) (p = 0.036). D OS of 65 BM-KRAS patients with EMD (Median OS: 3.0 years vs 9.6 years) (p = 0.002). E OS of 225 Non-BM-RAS/BRAF patients with EMD (Median OS: 7.3 years vs 8.7 years) (p = 0.028).

