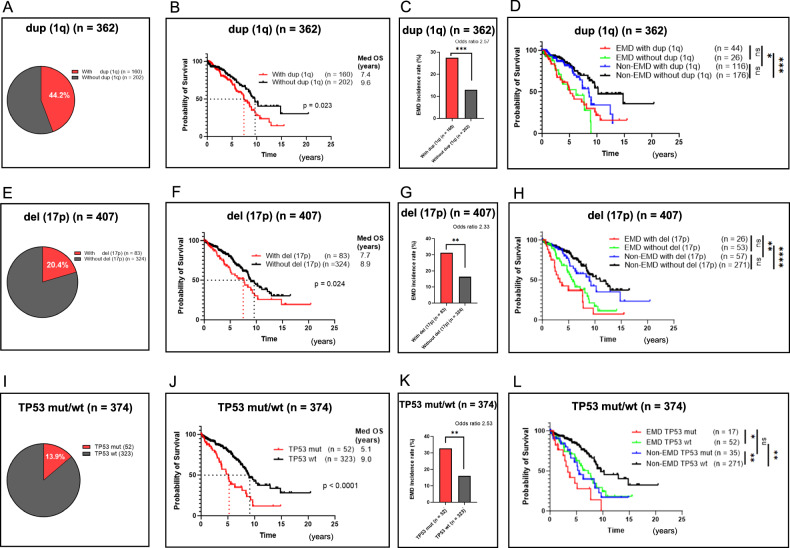
Fig. 3. Poor outcomes are noted in EMD patients with or without duplication 1q (dup (1q)) and deletion 17p (del (17p)).
TP53 mutation, however, portends a poor outcome regardless of the development of EMD. *p < 0.05; **p < 0.01; ***p < 0.001; ****p < 0.0001; ns, not significant. A Percentages of patients with and without dup (1q) (n = 362, 44.2% vs 55.8%). B OS of patients with and without dup (1q) (Median OS 7.4 years vs 9.6 years, p = 0.023). C EMD incidence rates of patients with and without dup (1q) (27.5% vs 12.9%, p < 0.001). D OS of EMD and non-EMD patients with and without dup (1q) (Median OS 5.1 years (red), 6.2 years (green), 8.5 years (blue), 10.2 years (black)). E Percentages of patients with and without del (17p) (n = 407, 20.4% vs 79.6%). F OS of patients with and without del (17p) (Median OS 7.7 years vs 8.9 years, p = 0.024). G EMD incidence rates of patients with and without del (17p) (31.3% vs 16.4%, p = 0.003). H OS of EMD and non-EMD patients with and without del (17p) (Median OS 3.4 years (red), 5.8 years (green), 9.0 years (blue), 11.0 years (black)). I Percentages of patients with TP53 mutation (mut) and TP53 wild-type (wt) (n = 374, 13.9% vs 86.1%). J OS of patients with TP53 mut and TP53 wt (Median OS 5.1 years vs 9.0 years, p < 0.0001). K EMD incidence rates of patients with TP53 mut and wt (32.7% vs 16.1%, p = 0.007). L OS of EMD and non-EMD patients with TP53 mut and TP53 wt (Median OS 3.4 years (red), 5.5 years (green), 7.3 years (blue), 9.6 years (black)).

