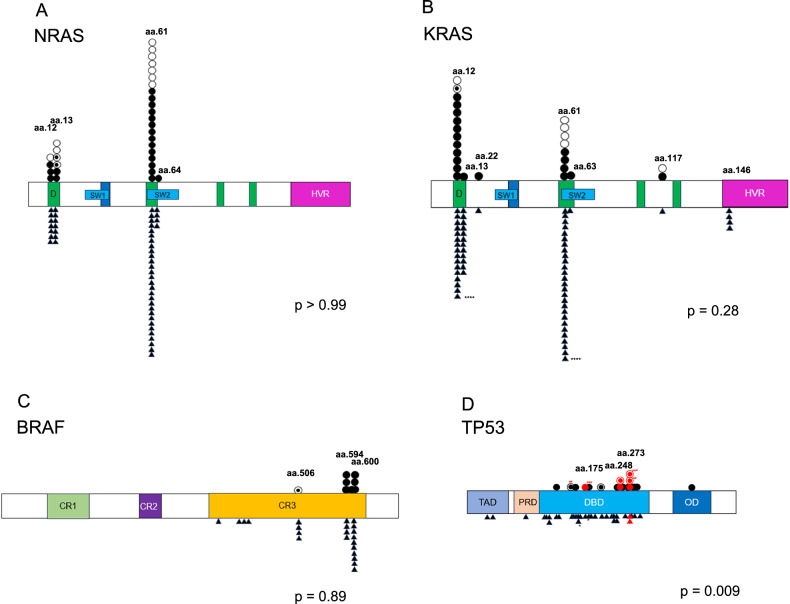
Fig. 4. Mutation sites differ with respect to TP53, but not RAS/BRAF, in EMD versus non-EMD patients.
Individual data points of mutations from EMD patients (above the gene bar) and non-EMD patients (below the gene bar) are represented(〇EMD tissue of EMD patients, ●BM of EMD patients, ◉Both BM and EMD tissue of EMD patients, ▲BM of non-EMD patients). The bar represents D (DNA binding lesion); SW (switch region); HVR, (hypervariable region); CR, (conserved region); TAD, (transactivation domain); PRD, (proline rich domain); DBD, (DNA binding domain); OD, (oligomerization domain). One non-EMD patient (*) and three EMD patients had 2 mutations in their samples (**, ***, and ****, respectively). Red symbols represent gain-of-function mutations. A Plots demonstrating NRAS mutation sites (p > 0.99). B Plots demonstrating KRAS mutation sites (p = 0.28). C Plots demonstrating BRAF mutation sites (p = 0.89). D Plots demonstrating TP53 mutation sites (p = 0.009).

