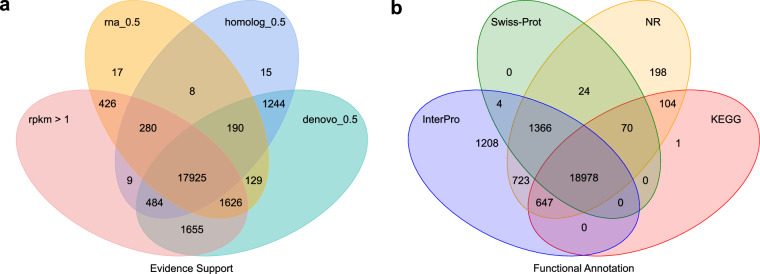
Fig. 5.
Gene prediction and functional annotation of the S. pavo genome. (a) Venn diagram of the gene sets predicted using a gene overlap greater than 50% between two or more of the following methods: de novo, genes supported by EVM-integrated de novo predictions; homolog, genes supported by EVM-integrated homologous predictions; RNA, genes supported by EVM-integrated RNA-seq data predictions. Gene predictions had a baseline gene expression, RPKM, greater than 1. (b) Venn diagram of functional annotation based on different protein databases: InterPro, Swiss-Prot, NR, and KEGG. The numbers represent the gene count.

