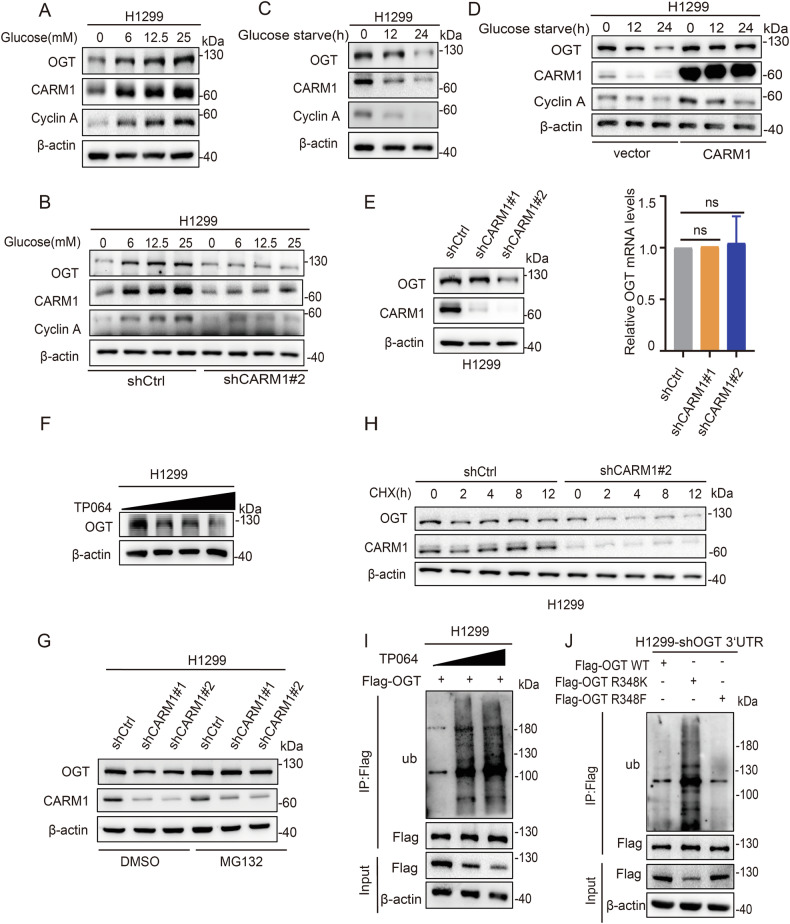
Fig. 3. Arginine methylation of OGT at R348 by CARM1 stabilizes OGT.
A H1299 cells were cultured with different concentrations of glucose for 18 h. CARM1 and OGT levels were analyzed by western blotting. B H1299 cells were transfected with CARM1 shRNA#2 or control vector and cultured with different concentrations of glucose for 18 h. OGT and CARM1 levels were analyzed by western blotting. C H1299 cells were cultured with glucose starvation for the indicated times. OGT and CARM1 levels were analyzed by western blotting. D H1299 cells were transfected with vector or CARM1 and cultured for the indicated times with glucose starvation. CARM1 and OGT levels were analyzed by western blotting. E The protein and relative mRNA expression levels of OGT in H1299 cells transfected with CARM1 shRNAs or control were assessed by western blotting and qPCR (error bars represent the mean ± SD, n = 3 experimental replicates, ns = not significant, Student’s t test). F. H1299 cells were treated with the indicated concentrations of TP064 for 24 h. The protein expression levels of OGT in cells were assessed by western blotting. G H1299 cells were transfected with control or CARM1 shRNAs and then treated with MG132 or DMSO for 8 h. Cell lysates were analyzed by western blotting. H H1299 cells were transfected with CARM1 shRNA#2 or control, and then treated with CHX (100 μg/mL) for the indicated time; OGT protein level was examined by western blotting. I H1299 cells expressing Flag-OGT were treated with increasing amounts of TP064 for 24 h. Co-IP assay was performed using anti-Flag and then subjected to western blotting. J H1299 cells were transfected with Flag-OGT WT/R348K/R348F after knocking down endogenous OGT. Co-IP assay was performed using anti-Flag and then subjected to western blotting.

